
Shenzhen College of International Education
Overview
Curriculum Type
ProfileType
International
直升安排
N/A
Classes & Students
Age Group
08.31
Grade Setup
K1 ~ G12
Teaching Language
Chinese Characters
Simplified Chinese
Religion
Religion
No Religion
Application Info
Minimum Application Grade
P1
Maximum Application Grade
P1
Useful Links
Contact
Phone
086-755-2655
Email
xue-e@szu.edu.cn
Map Location
G396+8V8, Huangganggongyuan St 1, Futian District, Shenzhen, Guangdong Province, China
Placement
2025 Study-abroad Country Analysis
2025Enrollment
2024Offers
| Country/Region | 2025Enrollment | Share | 2024Offers | Share |
|---|---|---|---|---|
| United States | 164 | 34.2% | 140 | 29.2% |
| United Kingdom | 41 | 8.5% | 48 | 10.0% |
| Hong Kong | - | - | 100 | 20.8% |
| Australia | - | - | 30 | 6.3% |
| Other | 275 | 57.3% | 162 | 33.8% |
| Total | 480 | 100.0% | 480 | 100.0% |
2025 University Tier Analysis
| University Tier | 2025Enrollment25Enrollment | 2025Enrollment%25% | 2025EnrollmentCumulative%25Cumulative | 2024Enrollment24Enrollment | 2024Enrollment%24% | 2024EnrollmentCumulative%24Cumulative | ΔOffers%Δ% |
|---|---|---|---|---|---|---|---|
| Total Students | 480 | 100.0% | - | 480 | 100.0% | - | - |
| HYPSM | 1 | 0.2% | - | - | - | - | +0.2% |
| Ivy League | 2 | 0.4% | - | - | - | - | +0.4% |
| US Top 10 | 4 | 0.8% | 0.8% | - | - | - | +0.8% |
| US Top 20 | 9 | 1.9% | 2.7% | - | - | - | +1.9% |
| UK Oxbridge | 41 | 8.5% | 11.3% | - | - | - | +8.5% |
| US Top 30 | 15 | 3.1% | 14.4% | - | - | - | +3.1% |
| Liberal Arts Top 10 | 5 | 1.0% | 15.4% | - | - | - | +1.0% |
| US Top 50 | 97 | 20.2% | 35.6% | - | - | - | +20.2% |
| Liberal Arts Top 20 | 7 | 1.5% | 37.1% | - | - | - | +1.5% |
| US Top 100 | 21 | 4.4% | 41.5% | - | - | - | +4.4% |
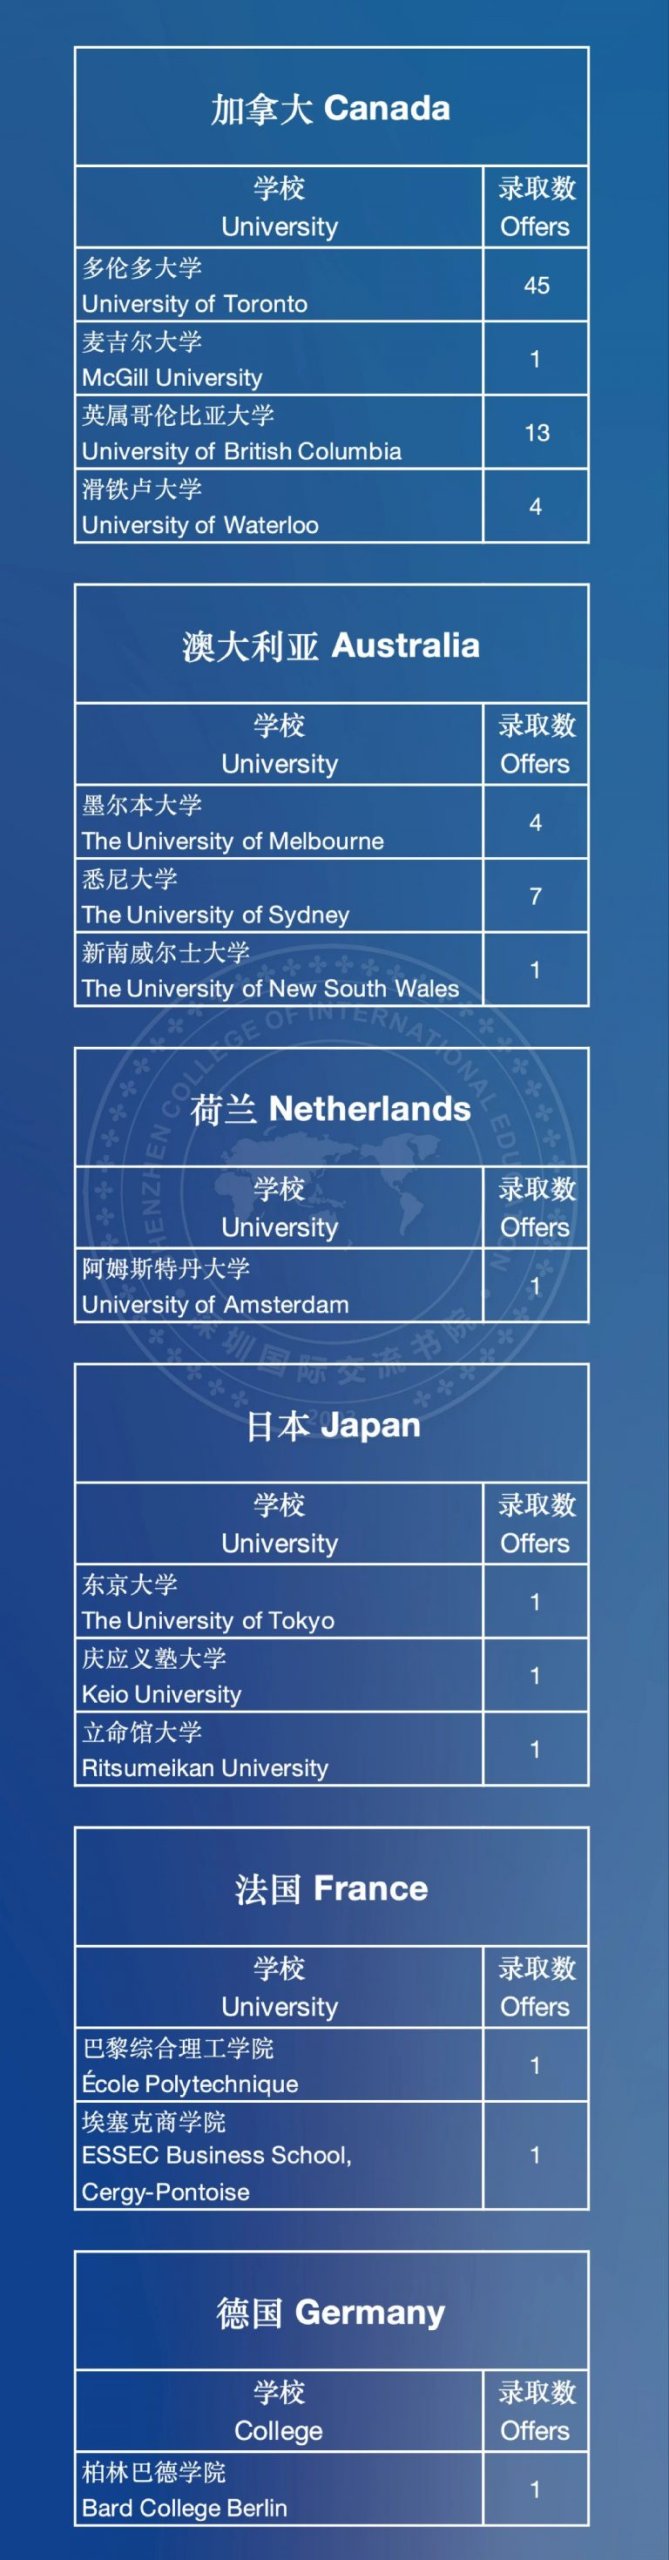
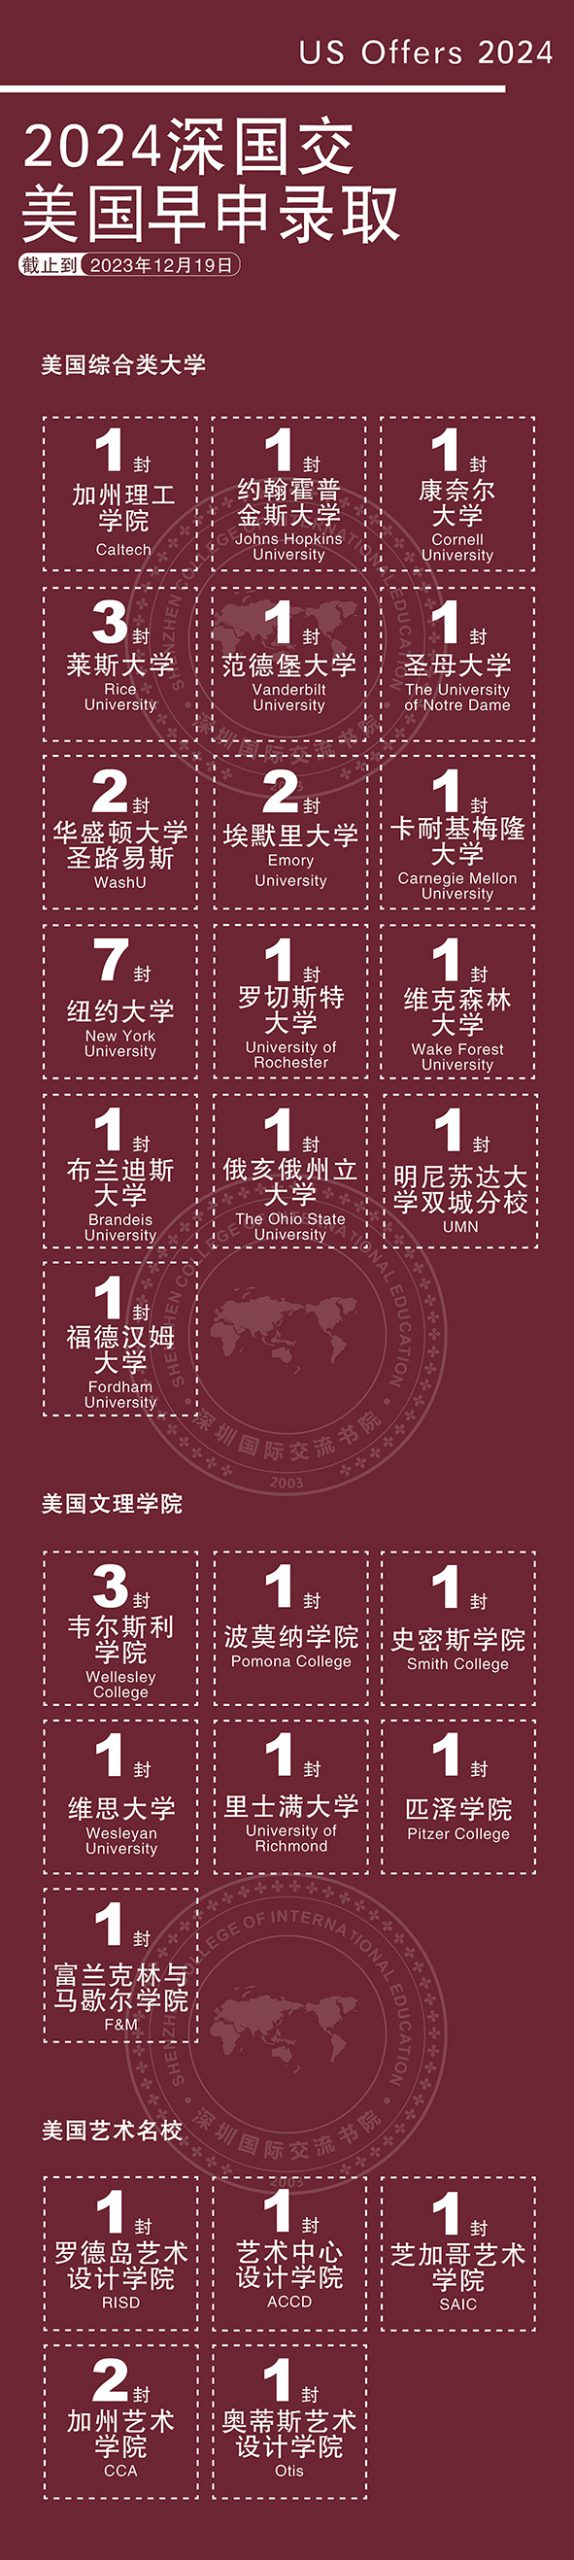
2024-2025 Detailed University Placement Results
| University Name | 25 Matriculations25 Matric. | 25 Matric. %25 % | 24 Offers24 Offers | 24 Offer %24 % | QS | US | THE | Country |
|---|---|---|---|---|---|---|---|---|
Stanford University | 1 | 0.2% | 1 | - | 3 | 4 | 6 | United States |
Harvard University | - | - | 1 | - | 5 | 3 | 5 | United States |
California Institute of Technology | - | - | 1 | - | 10 | 11 | 7 | United States |
University of Chicago | 1 | 0.2% | - | - | 13 | 6 | 15 | United States |
Cornell University | 1 | 0.2% | 4 | - | 16 | 12 | 18 | United States |
University of California, Berkeley | - | - | 5 | - | 17 | 15 | 9 | United States |
Johns Hopkins University | 1 | 0.2% | 1 | - | 24 | 7 | 16 | United States |
Columbia University | - | - | 1 | - | 38 | 15 | 20 | United States |
Northwestern University | 1 | 0.2% | - | - | 42 | 7 | 30 | United States |
University of Michigan-Ann Arbor | 1 | 0.2% | 6 | - | 45 | 20 | 23 | United States |
University of California, Los Angeles | - | - | 8 | - | 46 | 17 | 19 | United States |
Carnegie Mellon University | 2 | 0.4% | 4 | - | 52 | 20 | 24 | United States |
Duke University | - | - | 1 | - | 62 | 7 | 28 | United States |
Rice University | 3 | 0.6% | 6 | - | 119 | 17 | 103 | United States |
University of North Carolina, Chapel Hill | 7 | 1.5% | 10 | - | 140 | 26 | 78 | United States |
Washington University in St. Louis | 1 | 0.2% | 3 | - | 167 | 20 | 67 | United States |
Emory University | 5 | 1.0% | 2 | - | 182 | 24 | 102 | United States |
Dartmouth College | 1 | 0.2% | - | - | 247 | 13 | 180 | United States |
Vanderbilt University | - | - | 1 | - | 250 | 17 | 92 | United States |
Others/National Service | 275 | 57.3% | 162 | - | - | - | - | Other |
Data Notes
Matriculation counts students who finally enroll at a university. Since each student enrolls in only one university, total matriculations usually do not exceed total graduates.
Offer counts admission offers received by students. A student may receive multiple offers, so total offers are usually higher than total graduates.
| University Name | 25 Matriculations25 Matric. | 25 Matric. %25 % | 24 Offers24 Offers | 24 Offer %24 % | QS | US | THE |
|---|---|---|---|---|---|---|---|
Harvard University | - | - | 1 | - | 5 | 3 | 5 |
Stanford University | 1 | 0.2% | 1 | - | 3 | 4 | 6 |
University of Chicago | 1 | 0.2% | - | - | 13 | 6 | 15 |
Duke University | - | - | 1 | - | 62 | 7 | 28 |
Johns Hopkins University | 1 | 0.2% | 1 | - | 24 | 7 | 16 |
Northwestern University | 1 | 0.2% | - | - | 42 | 7 | 30 |
California Institute of Technology | - | - | 1 | - | 10 | 11 | 7 |
Cornell University | 1 | 0.2% | 4 | - | 16 | 12 | 18 |
Dartmouth College | 1 | 0.2% | - | - | 247 | 13 | 180 |
Columbia University | - | - | 1 | - | 38 | 15 | 20 |
University of California, Berkeley | - | - | 5 | - | 17 | 15 | 9 |
University of California, Los Angeles | - | - | 8 | - | 46 | 17 | 19 |
Rice University | 3 | 0.6% | 6 | - | 119 | 17 | 103 |
Vanderbilt University | - | - | 1 | - | 250 | 17 | 92 |
Carnegie Mellon University | 2 | 0.4% | 4 | - | 52 | 20 | 24 |
University of Michigan-Ann Arbor | 1 | 0.2% | 6 | - | 45 | 20 | 23 |
Washington University in St. Louis | 1 | 0.2% | 3 | - | 167 | 20 | 67 |
Emory University | 5 | 1.0% | 2 | - | 182 | 24 | 102 |
University of North Carolina, Chapel Hill | 7 | 1.5% | 10 | - | 140 | 26 | 78 |
University of Southern California | 2 | 0.4% | - | - | 146 | 28 | 73 |
| University Name | 25 Matriculations25 Matric. | 25 Matric. %25 % | 24 Offers24 Offers | 24 Offer %24 % | QS | US | THE |
|---|---|---|---|---|---|---|---|
Imperial College London | - | - | - | - | 2 | - | 8 |
University of Oxford | 8 | 1.7% | 16 | - | 4 | - | 1 |
University of Cambridge | 33 | 6.9% | 32 | - | 6 | - | 4 |
University College London | - | - | - | - | 9 | - | - |
London School of Economics and Political Science | - | - | - | - | 56 | - | 52 |
Sources
×
1 / 1
Living
Living & Commute Recommendations
| # | Estate | Best Commute | Commute Time | Distance | Overall Score |
|---|---|---|---|---|---|
| Loading... | |||||
Note: Monthly rent/total price are estimates based on government RVD monthly residential averages by area and size, for school-living decisions only.
-