
St Paul'S College
- SPC
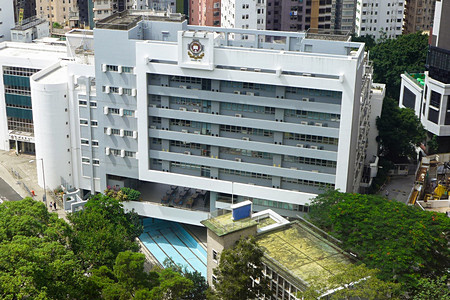
圣保罗书院(英语:St. Paul's College,缩写SPC)是香港一所基督教男子学校,也是香港现存历史最悠久的学校。该校于1876年加入香港补助学校议会,亦即被坊间称为“传统名校”的22间学校之一。该校设有小学部及中学部,俱只收男生。2002年圣保罗书院转为直资学校。目前中学部校舍位于中西区西半山般咸道67-69号,小学部则已迁离西区,并于2013年落户港岛南区薄扶林域多利道777号的全新校舍。
全港DSE成绩最好的男校。
Overview
Application Info
Useful Links
Contact
Map Location
Student Distribution
结论:
全校总人数增长4.2%,初中班额接近饱和,但高中阶段各年级均出现不同程度的学生流失。
要点:
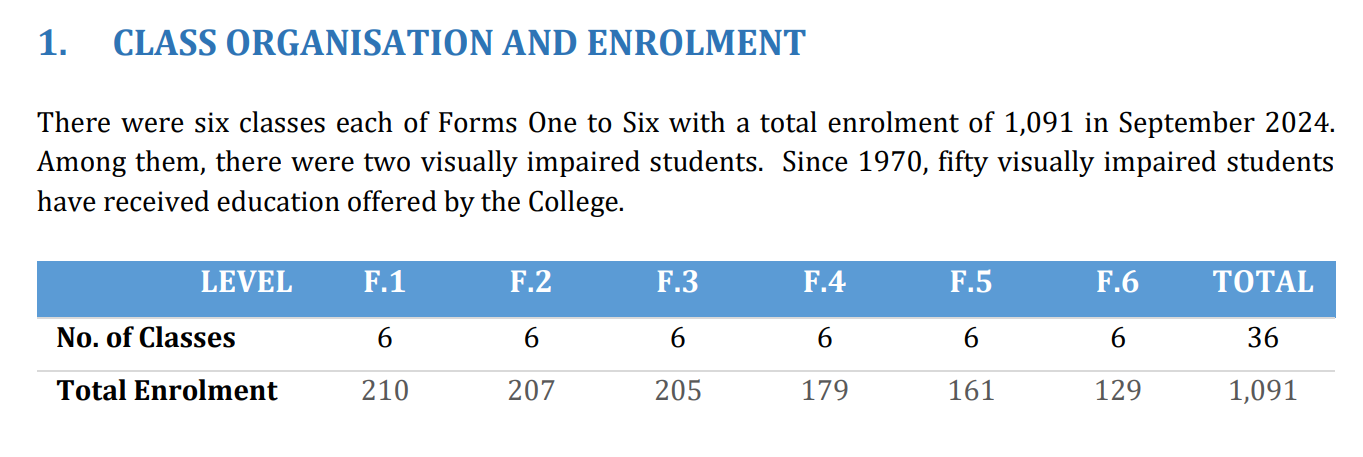
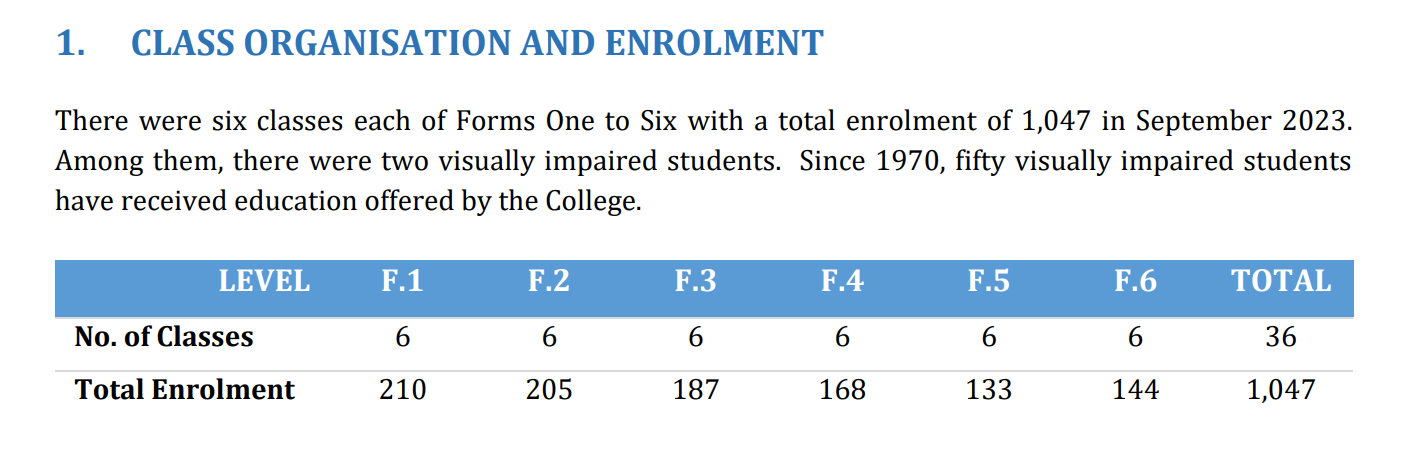
- 总人数规模扩张: 2024-25学年总人数由1,047人增至1,091人,在班级总数维持36班不变下,整体密度提升。
- 低年级班额饱和: S1每班平均35人,为全校最高;S1至S3每班均超34人,初中教学资源利用率已达极限。
- 高中部持续流失: S4及S5批次人数较去年分别减少8人和7人,显示升学衔接阶段存在较明显的学生流失。
- 高低年级差异显著: S6每班仅21.5人,与S1(35人)差距达13.5人,高年级小班化趋势并非主动规划而是流失导致。
- 招生规模稳定: S1连续两年维持210人招生规模,显示学校在入口端具备稳定的生源吸引力。
建议:
需调研高中部(尤其是S4-S5)学生流失的具体原因,同时针对初中部饱和班额优化教学资源配置。
Student Enrollment Trend
| Grade | 2024-2025 | 2023-2024 | Δ Students | ||||
|---|---|---|---|---|---|---|---|
| Students | Classes | Students / Class | Students | Classes | Students / Class | ||
| S1 | 210 | 6 | 35 | 210 | 6 | 35 | - |
| S2 | 207 | 6 | 34.5 | 205 | 6 | 34.2 | ▼ 3 |
| S3 | 205 | 6 | 34.2 | 187 | 6 | 31.2 | - |
| S4 | 179 | 6 | 29.8 | 168 | 6 | 28 | ▼ 8 |
| S5 | 161 | 6 | 26.8 | 133 | 6 | 22.2 | ▼ 7 |
| S6 | 129 | 6 | 21.5 | 144 | 6 | 24 | ▼ 4 |
| Total | 1,091 | 36 | 30.3 | 1,047 | 36 | 29.1 | ▲ 44 |
Sources
Fees
Fee Information
| Grade | School Level | Age | Fees | Stage |
|---|---|---|---|---|
| G7 | S1 | 12 | $44,000 | 中一 |
| G8 | S2 | 13 | $44,000 | 中二 |
| G9 | S3 | 14 | $44,000 | 中三 |
| G10 | S4 | 15 | $44,000 | 中四 |
| G11 | S5 | 16 | $44,000 | 中五 |
| G12 | S6 | 17 | $44,000 | 中六 |
Sources

Exam
结论:
DSE与A-Level成绩稳步上升,全港排名第8,高分段比例及理科优势显著。
要点:
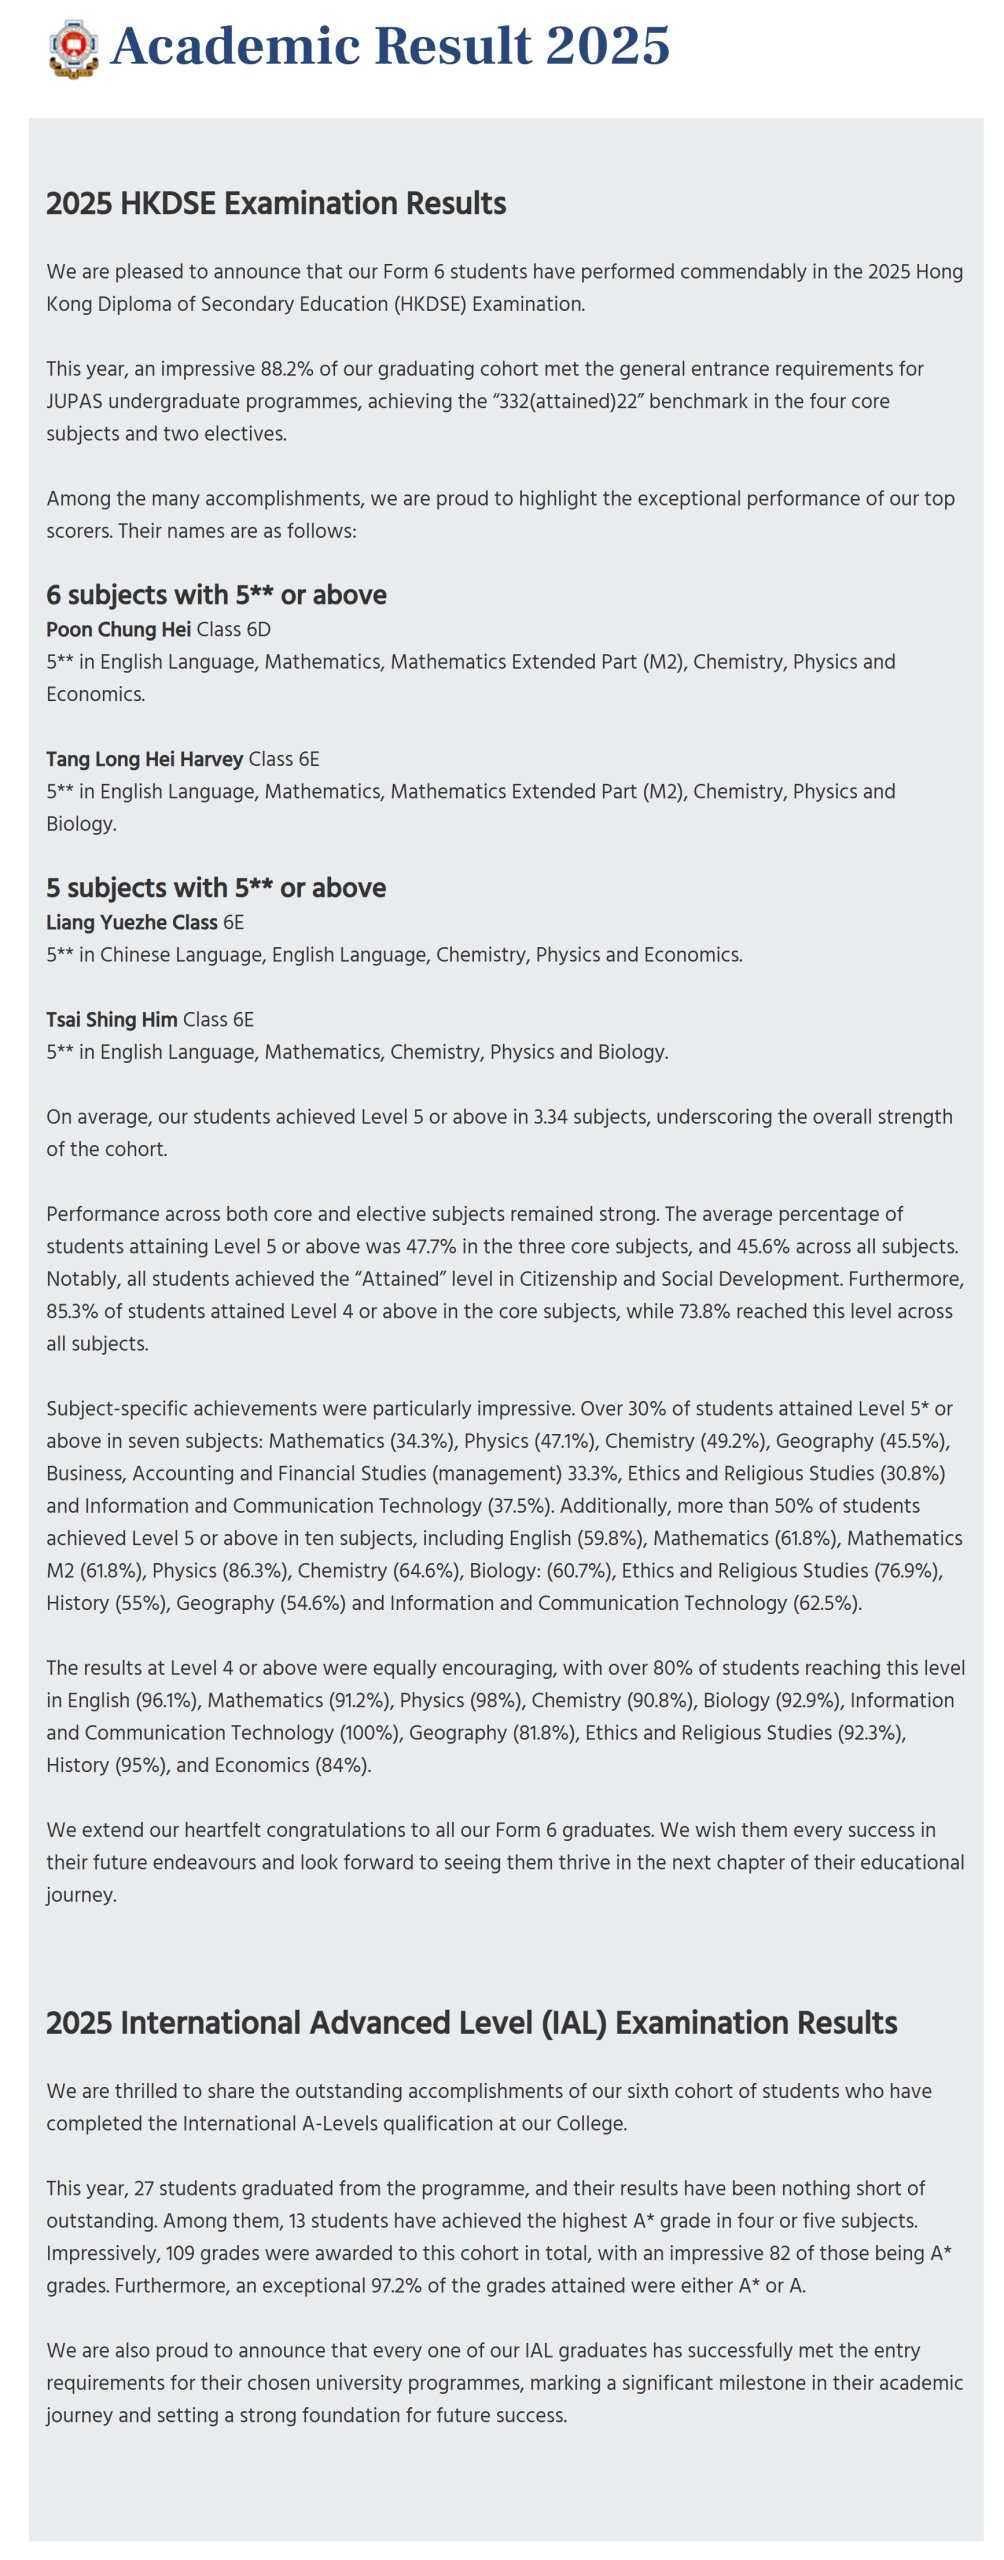
- 排名领先: DSE成绩位列全港第8名,大学门槛(332A)达标率稳定在88.2%的高位。
- 高分段增长: Level 5+总分比例升至52.9%,较去年增长3.5%,整体学术表现持续优化。
- 中文科突破: 中文科进步明显,Level 4+比例大幅提升19%,Level 5+比例亦增长7.5%。
- 理科优势突出: 物理5+比例高达86.3%,化学5+比例较去年显著增长11.3%,学科竞争力强。
- 双轨成绩亮眼: A-Level表现卓越,A率达75.2%,近半数考生(48.1%)取得4A佳绩。
建议:
建议继续强化中文科拔尖教学,并利用理科强势学科经验,进一步提升DSE及A-Level的高分段占比。
DSE Overview
| Metrics | 2025 | 2024 | 2023 | Change |
|---|---|---|---|---|
| Key Metrics | ||||
| 332A (Universities门槛) | 88.2% | 88.5% | 85.3% | ▼ 0.3% |
| 332A Notes | 332A22 | 332A22 | 33222 | - |
| Level 5+ (优秀) | ||||
| Total 5+ | 52.9% | 49.4% | 51.2% | ▲ 3.5% |
| CEM 5+ (主科) | 47.7% | 44.2% | 52.8% | ▲ 3.5% |
| Chinese 5+ | 21.5% | 14.0% | 45.8% | ▲ 7.5% |
| English 5+ | 59.8% | 57.5% | 53.9% | ▲ 2.3% |
| 数学 5+ | 61.8% | 61.1% | 58.8% | ▲ 0.7% |
| Level 4+ (良好) | ||||
| Total 4+ | 85.4% | 80.8% | 80.7% | ▲ 4.6% |
| CEM 4+ (主科) | 85.3% | 77.6% | 86.1% | ▲ 7.7% |
| Chinese 4+ | 68.6% | 49.6% | 80.0% | ▲ 19.0% |
| English 4+ | 96.1% | 93.8% | 94.1% | ▲ 2.3% |
| 数学 4+ | 91.2% | 89.4% | 84.3% | ▲ 1.8% |
| 人数 | ||||
| DSE Candidates | 102 | 144 | 103 | ▼ 42 |
| Non-DSE Candidates | 27 | 31 | 25 | ▼ 4 |
DSE Subject Results
| Subject | 2025 (%) | 2024 (%) | Change |
|---|---|---|---|
| Chinese History | - | 37.5 | - |
| Compulsory Mathematics | 34.3 | - | - |
| Mathematics M2 | - | 33.3 | - |
| Chemistry | 49.2 | 34.7 | ▲ 14.5 |
| Physics | 47.1 | 48.1 | ▼ 1.0 |
| Geography | 45.5 | - | - |
| ICT | 37.5 | - | - |
| BAFS Accounting | 33.3 | - | - |
| ICT | - | 33.3 | - |
| Religious Studies | 30.8 | 30.1 | ▲ 0.7 |
| Chinese | 76.9 | - | - |
| Chinese History | 55.0 | 62.5 | ▼ 7.5 |
| English | 59.8 | 57.5 | ▲ 2.3 |
| Compulsory Mathematics | 61.8 | 61.1 | ▲ 0.7 |
| Mathematics M1 | - | 60.7 | - |
| Mathematics M2 | 61.8 | 75.8 | ▼ 14.0 |
| Physics | 86.3 | 85.2 | ▲ 1.1 |
| Chemistry | 64.6 | 53.3 | ▲ 11.3 |
| ICT | 62.5 | - | - |
| Biology | 60.7 | - | - |
| Music | - | 60.0 | - |
| Geography | 54.6 | 60.0 | ▼ 5.4 |
| Chinese | 100.0 | - | - |
| Chinese History | 95.0 | 100.0 | ▼ 5.0 |
| English | 96.1 | 93.8 | ▲ 2.3 |
| Compulsory Mathematics | 91.2 | 89.4 | ▲ 1.8 |
| Mathematics M2 | - | 87.9 | - |
| History | - | 100.0 | - |
| Music | - | 100.0 | - |
| Physics | 98.0 | 98.1 | ▼ 0.1 |
| Biology | 92.9 | 84.6 | ▲ 8.3 |
| Religious Studies | 92.3 | - | - |
| Chemistry | 90.8 | - | - |
| ICT | - | 88.9 | - |
| Economics | 84.0 | - | - |
| Geography | 81.8 | 80.0 | ▲ 1.8 |
Other Exam Results
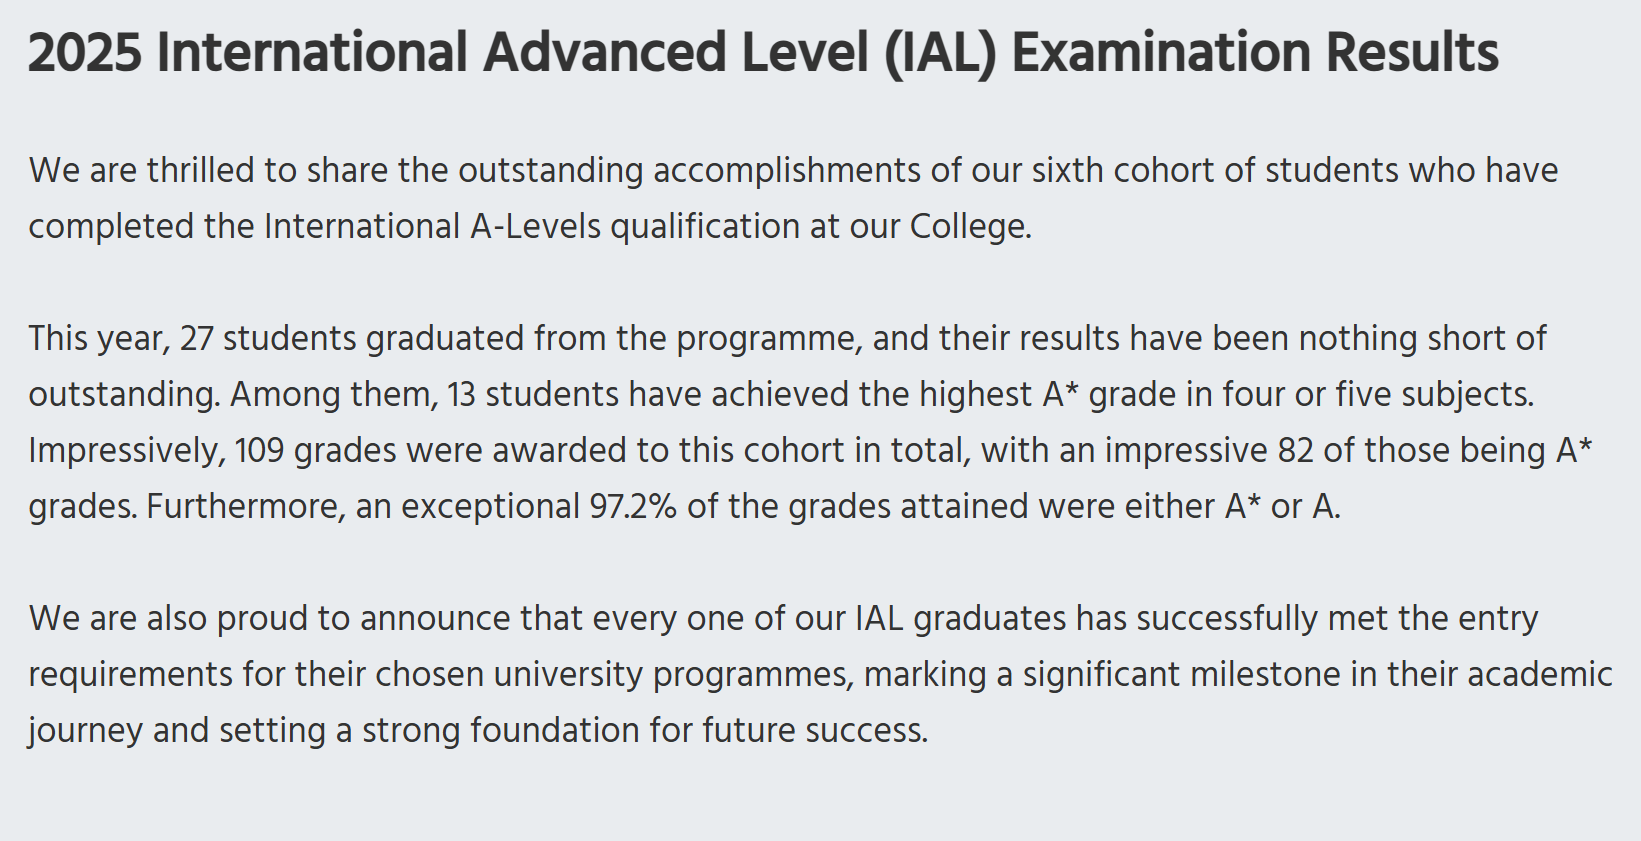
A Level Results
| Item | 2025 | 2024 | 2023 |
|---|---|---|---|
| Number of Candidates | 27 | 31 | 25 |
| A Level A* % | 75.2% | 67.8% | 57.6% |
| A Level A*/A % | 97.2% | 95% | 83% |
| A Level 4A* % | 48.1% | 45.1% | 44% |
| A Level 4A* Count | 13 | 14 | 11 |
Sources
Placement
结论:
2025年香港名校录取率稳步提升,顶尖英美名校表现亮眼,但整体本科率略有下滑。
要点:
- 香港名校录取走高: 香港三大录取率升至58.9%(+3.3%),五大及九大率均有1.6%-1.7%的增长。
- 英本G5优势显著: 2025年G5录取占比高达42.9%,牛剑录取达14人,英国顶尖名校申请竞争力极强。
- 美本高端录取突破: 成功斩获1枚哈耶普斯麻及5枚藤校录取,美本T10及T20梯队累计录取率达8.3%。
- 海外升学占比下降: 海外本科率由16%降至12%,导致总本科率从95%小幅下滑至91.8%。
- 升学路径趋向多元: 自资学位(4%)与VTC(6%)比例微升,显示学生在择校时更加务实与多样化。
建议:
在保持香港三大申请优势的同时,建议利用G5高录取率优势,通过英美港多轨并行策略规避本科率波动风险。
University Placement Analysis
| Placement Destinations | 2025Year | 2024Year | Change |
|---|---|---|---|
| Hong KongTop 3 Rate | 58.9% | 55.6% | ▲ 3.3% |
| Hong KongTop 4 Rate | 67.4% | 67.7% | ▼ 0.3% |
| Hong KongTop 5 Rate | 76.7% | 75.0% | ▲ 1.7% |
| Hong Kong九大率 | 79.8% | 78.2% | ▲ 1.6% |
| JUPAS Rate | - | 95.0% | - |
| Bachelor and Associate Degree Rate | 91.8% | 95.0% | ▼ 3.2% |
| 总本科率(本地+Overseas) | 91.8% | 95.0% | ▼ 3.2% |
| Hong Kong本地本科率 | 78.0% | 79.0% | ▼ 1.0% |
| Overseas本科率 | 12.0% | 16.0% | ▼ 4.0% |
| SSSDP Rate | - | 7.0% | - |
| Self-financed Degree Rate | 4.0% | 0.0% | ▲ 4.0% |
| VTC率 | 6.0% | 4.0% | ▲ 2.0% |
| Progression Rate | 99.0% | 99.0% | - |
| Repeat Year Rate | 1.0% | 1.0% | - |
2025 University Tier Analysis
| University Tier | 2025Enrollment25Enrollment | 2025Enrollment%25% | 2025EnrollmentCumulative%25Cumulative | 2024Enrollment24Enrollment | 2024Enrollment%24% | 2024EnrollmentCumulative%24Cumulative | ΔOffers%Δ% |
|---|---|---|---|---|---|---|---|
| Total Students | 129 | 100.0% | - | 144 | 100.0% | - | - |
| UK G5 | 5 | 3.9% | 3.9% | - | - | - | +3.9% |
| HK Top 3 | 76 | 58.9% | 62.8% | 86 | 59.7% | 59.7% | -0.8% |
| HK Top 4 | 11 | 8.5% | 71.3% | 5 | 3.5% | 63.2% | +5.1% |
| UK Top 10 | 2 | 1.6% | 72.9% | - | - | 63.2% | +1.6% |
| HK Top 5 | 12 | 9.3% | 82.2% | 9 | 6.3% | 69.4% | +3.1% |
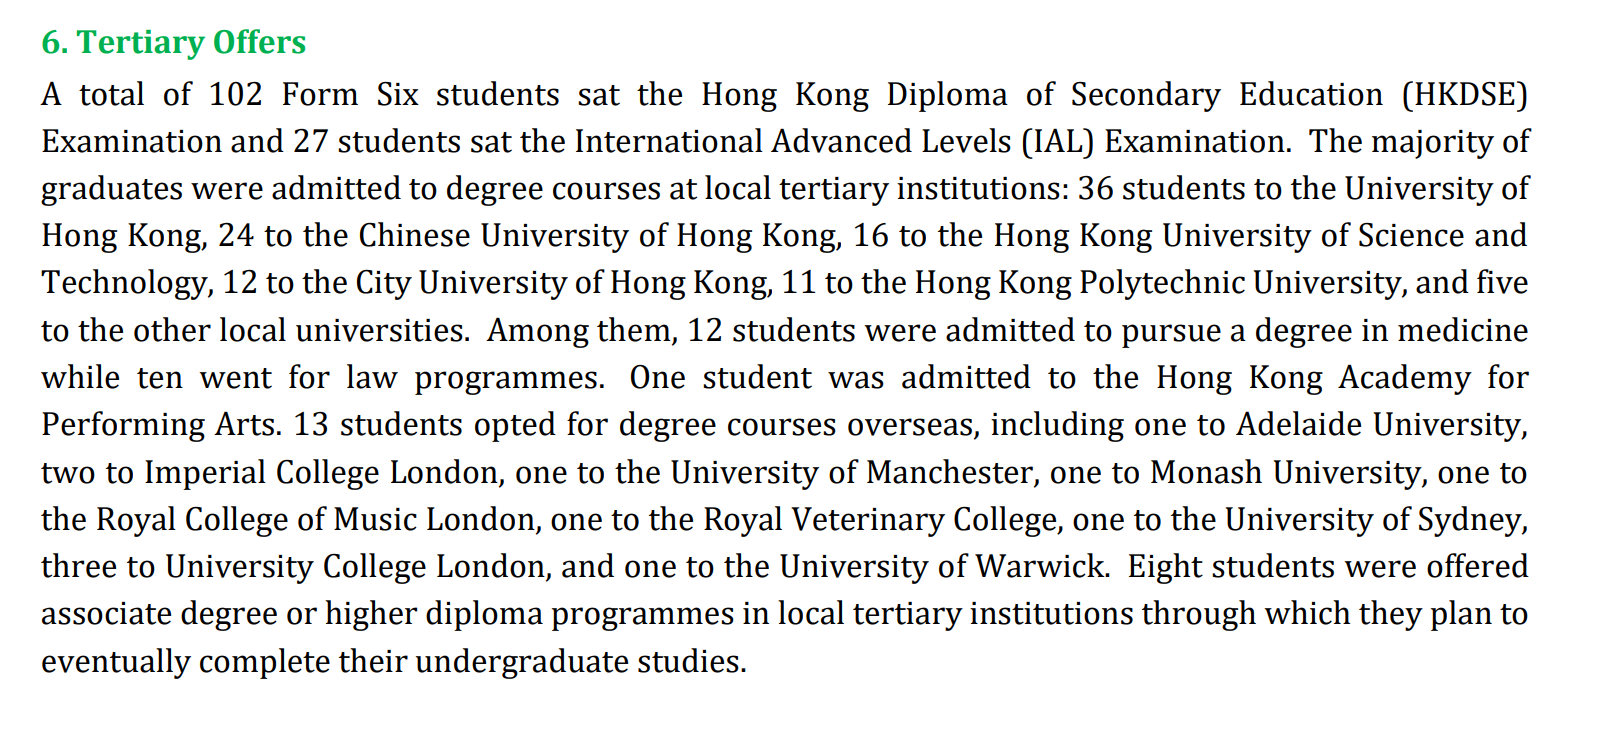
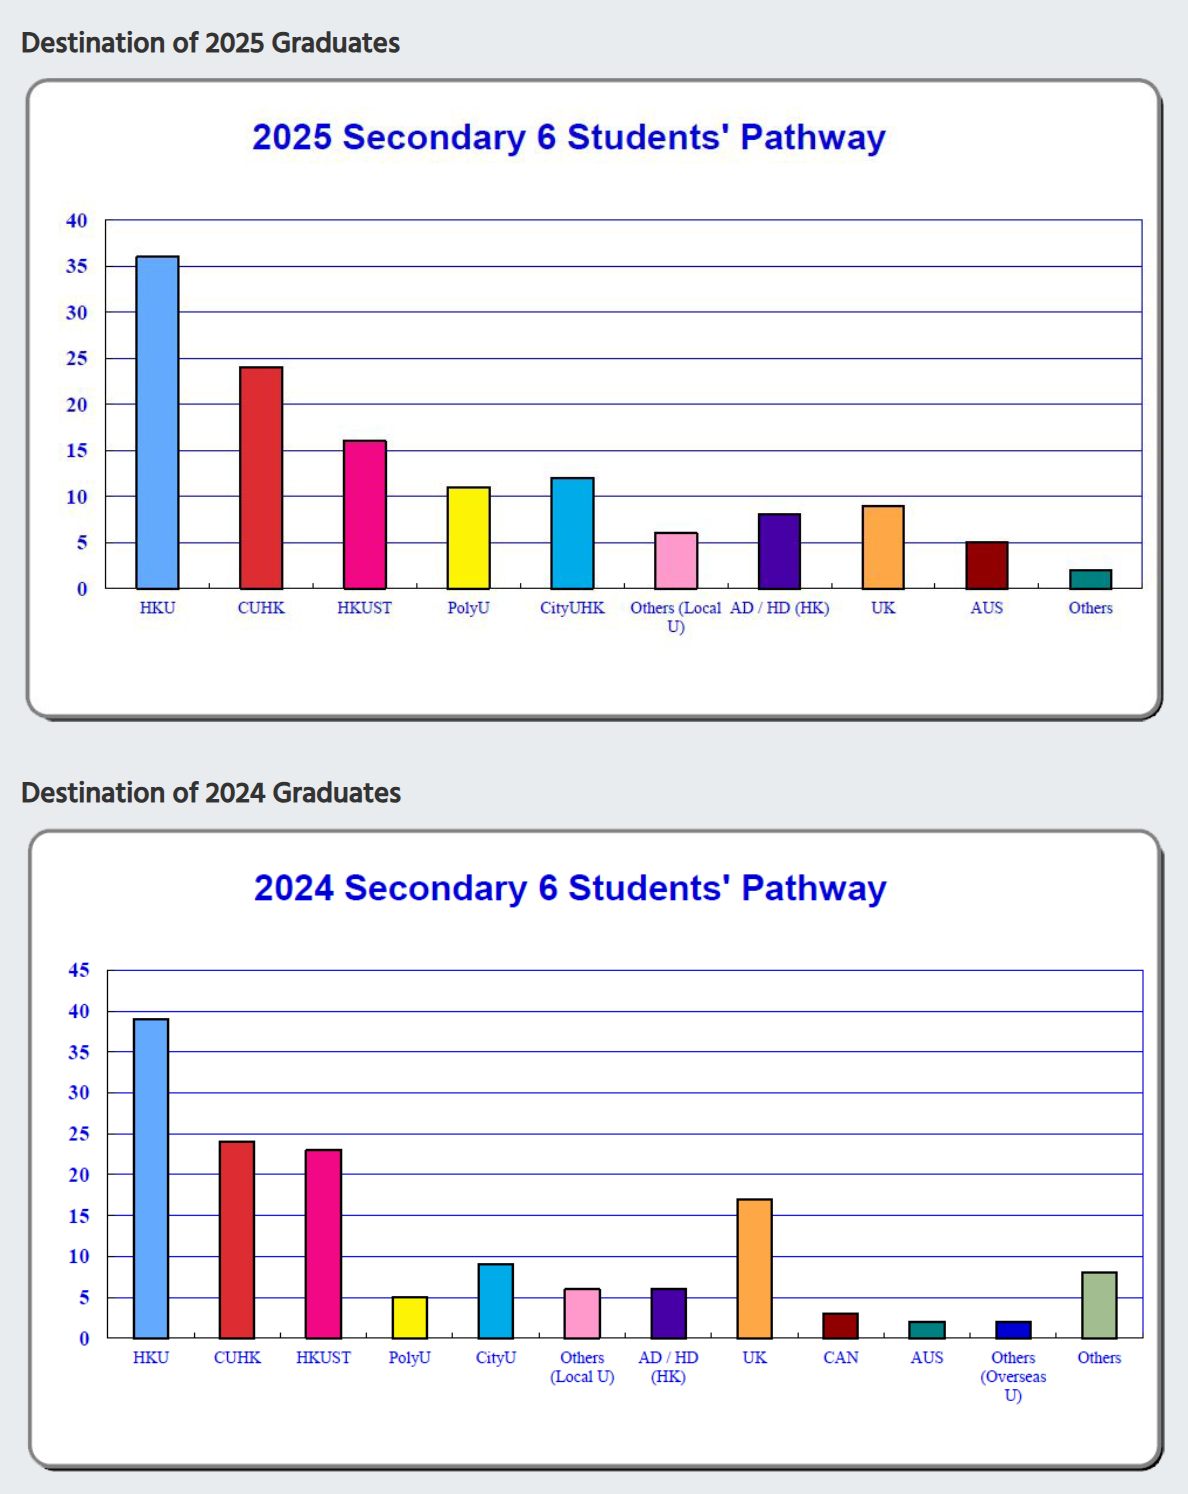
Detailed University Placement Results
| University Name | 25 Matriculations25 Matric. | 25 Matric. %25 % | 24 Matriculations24 Matric. | 24 Matric. %24 % | QS | US | THE | Country |
|---|---|---|---|---|---|---|---|---|
Imperial College London | 2 | 1.6% | - | - | 2 | - | 8 | United Kingdom |
University College London | 3 | 2.4% | - | - | 9 | - | - | United Kingdom |
The University of Hong Kong | 36 | 29.0% | 39 | 27.1% | 11 | - | - | 中国Hong Kong |
The University of Sydney | 1 | 0.8% | - | - | 25 | - | 54 | Australia |
The Chinese University of Hong Kong | 24 | 19.4% | 24 | 16.7% | 32 | - | 43 | 中国Hong Kong |
Monash University | 1 | 0.8% | - | - | 36 | - | 58 | Australia |
The Hong Kong University of Science and Technology | 16 | 12.9% | 23 | 16.0% | 44 | - | 60 | 中国Hong Kong |
The Hong Kong Polytechnic University | 11 | 8.9% | 5 | 3.5% | 54 | - | 80 | 中国Hong Kong |
City University of Hong Kong | 12 | 9.7% | 9 | 6.3% | 63 | - | 73 | 中国Hong Kong |
Others/National Service | 4 | 3.2% | 38 | 26.4% | - | - | - | Other |
Hong Kong Academy for Performing Arts | 1 | 0.8% | - | - | - | - | - | 中国Hong Kong |
University of Adelaide | 1 | 0.8% | - | - | - | - | - | Australia |
University of Manchester | 1 | 0.8% | - | - | - | - | 56 | United Kingdom |
Royal College of Music | 1 | 0.8% | - | - | - | - | - | United Kingdom |
Royal Veterinary College | 1 | 0.8% | - | - | - | - | - | United Kingdom |
University of Warwick | 1 | 0.8% | - | - | - | - | 122 | United Kingdom |
Associate Degree Program | 8 | 6.5% | 6 | 4.2% | - | - | - | 副学士/预科 |
Matriculation counts students who finally enroll at a university. Since each student enrolls in only one university, total matriculations usually do not exceed total graduates.
Offer counts admission offers received by students. A student may receive multiple offers, so total offers are usually higher than total graduates.
| University Name | 25 Matriculations25 Matric. | 25 Matric. %25 % | QS | US | THE |
|---|---|---|---|---|---|
Imperial College London | 2 | 1.6% | 2 | - | 8 |
University College London | 3 | 2.4% | 9 | - | - |
University of Manchester | 1 | 0.8% | - | - | 56 |
Royal College of Music | 1 | 0.8% | - | - | - |
Royal Veterinary College | 1 | 0.8% | - | - | - |
University of Warwick | 1 | 0.8% | - | - | 122 |
| University Name | 25 Matriculations25 Matric. | 25 Matric. %25 % | 24 Matriculations24 Matric. | 24 Matric. %24 % | QS | US | THE |
|---|---|---|---|---|---|---|---|
The University of Hong Kong | 36 | 29.0% | 39 | 27.1% | 11 | - | - |
The Chinese University of Hong Kong | 24 | 19.4% | 24 | 16.7% | 32 | - | 43 |
The Hong Kong University of Science and Technology | 16 | 12.9% | 23 | 16.0% | 44 | - | 60 |
The Hong Kong Polytechnic University | 11 | 8.9% | 5 | 3.5% | 54 | - | 80 |
City University of Hong Kong | 12 | 9.7% | 9 | 6.3% | 63 | - | 73 |
Hong Kong Academy for Performing Arts | 1 | 0.8% | - | - | - | - | - |
Sources
Living
Living & Commute Recommendations
| # | Estate | Best Commute | Commute Time | Distance | Overall Score |
|---|---|---|---|---|---|
| Loading... | |||||
Note: Monthly rent/total price are estimates based on government RVD monthly residential averages by area and size, for school-living decisions only.