
Hkuga College
- HKUGAC
称为新派直资学校,创校于2003年,历史较短,但DSE成绩进步很快。2024年开始增开A Level课程,但目前只有少数理科科目可供选修。一个年级7个班,中英数均分精英班和平行班。课外活动非常丰富,多达100多种,乐器类的课外活动要额外收费。学校要求一人一乐器,可参加合唱团代替。中学一个班3个班主任,分别是中文、英文和外教老师担任班主任。
全港本地DSE学校中按升学成绩排名全港前20,位居新派直资学校中的头部,是Band1A中学。
Overview
Application Info
Useful Links
Contact
Map Location
Student Distribution
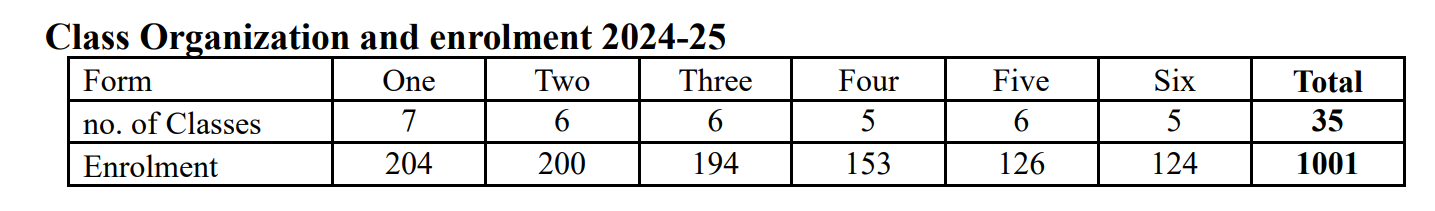
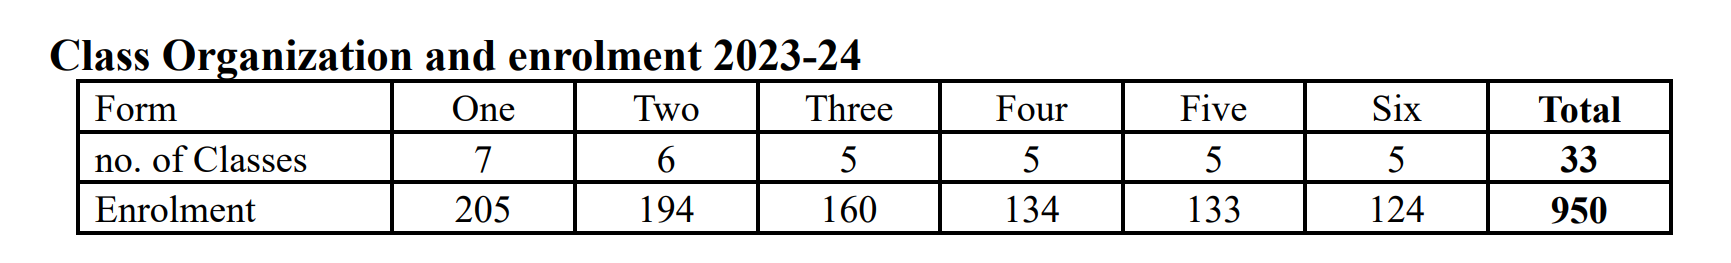
结论: 学校总人数突破千人,初中班额较饱和,高中部呈现小班化教学趋势且存在学生流失。
要点:
- 2024-25学年总人数增至1,001人,较上年增加51人,总班级数由33班扩至35班。
- 初中部班额较高,S2每班平均33.3人为全校最高;S1维持7班规模,每班约29.1人。
- 高中部实行小班化,S5每班仅21人,虽学生总数减少但班级数反增至6班,教学资源投入明显。
- 存在跨年级流失,S4至S6各年级对比去年同批次学生分别减少7、8、9人,高年级流失略有扩大。
- S3学生留存率最高,对比去年S2人数无变动,显示初中升学衔接阶段生源极其稳定。
建议:
关注高中部学生流失原因,并利用S5、S6小班教学优势,强化升学辅导以提升高年级学生留存率。
Student Enrollment Trend
| Grade | 2024-2025 | 2023-2024 | Δ Students | ||||
|---|---|---|---|---|---|---|---|
| Students | Classes | Students / Class | Students | Classes | Students / Class | ||
| S1 | 204 | 7 | 29.1 | 205 | 7 | 29.3 | - |
| S2 | 200 | 6 | 33.3 | 194 | 6 | 32.3 | ▼ 5 |
| S3 | 194 | 6 | 32.3 | 160 | 5 | 32 | - |
| S4 | 153 | 5 | 30.6 | 134 | 5 | 26.8 | ▼ 7 |
| S5 | 126 | 6 | 21 | 133 | 5 | 26.6 | ▼ 8 |
| S6 | 124 | 5 | 24.8 | 124 | 5 | 24.8 | ▼ 9 |
| Total | 1,001 | 35 | 28.6 | 950 | 33 | 28.8 | ▲ 51 |
Sources
Relation
Fees
Fee Information
| Grade | School Level | Age | Fees | Stage |
|---|---|---|---|---|
| G7 | S1 | 12 | $44,000 | 中一 |
| G8 | S2 | 13 | $44,000 | 中二 |
| G9 | S3 | 14 | $44,000 | 中三 |
| G10 | S4 | 15 | $46,600 | 中四 |
| G11 | S5 | 16 | $46,600 | 中五 |
| G12 | S6 | 17 | $46,600 | 中六 |
Sources

Exam
结论:
2025年DSE成绩显著回升,大学门槛达标率升至93.4%,全港排名位列第12名。
要点:
- 门槛达标率反弹: 大学门槛(332A)达标率较去年大幅增长14.4%,成功恢复至2023年高位水平。
- 全港排名领先: 在全港DSE排名中位列第12名,表现优于庇理罗士女子中学等传统名校。
- 中文科进步显著: 中文科Level 5+率提升8.5%至28.8%,Level 4+率亦同步增长9.3%。
- 高分段略有波动: 英文和数学科的Level 5+率分别下滑5.6%和1.0%,高分段表现出现小幅萎缩。
- 中坚力量稳固: 整体Level 4+率达80.3%,核心科目(CEM)达标率全面回升,显示生源质量稳定。
建议:
在保持中文科增势的同时,应针对英文及数学科高分段(Level 5+)进行专项强化,以稳固排名优势。
DSE Overview
| Metrics | 2025 | 2024 | 2023 | Change |
|---|---|---|---|---|
| Key Metrics | ||||
| 332A (Universities门槛) | 93.4% | 79.0% | 91.5% | ▲ 14.4% |
| 332A Notes | 332A | 332A | 3322 | - |
| Level 5+ (优秀) | ||||
| Total 5+ | 47.3% | 46.3% | 51.9% | ▲ 1.0% |
| Total 5* | 24.0% | 23.7% | 28.1% | ▲ 0.3% |
| CEM 5+ (主科) | 42.1% | 41.5% | 48.4% | ▲ 0.6% |
| Chinese 5+ | 28.8% | 20.3% | 32.1% | ▲ 8.5% |
| English 5+ | 54.1% | 59.7% | 61.0% | ▼ 5.6% |
| 数学 5+ | 43.4% | 44.4% | 52.1% | ▼ 1.0% |
| Level 4+ (良好) | ||||
| Total 4+ | 80.3% | 75.2% | 81.6% | ▲ 5.1% |
| CEM 4+ (主科) | 76.9% | 71.5% | 80.8% | ▲ 5.4% |
| Chinese 4+ | 59.3% | 50.0% | 71.4% | ▲ 9.3% |
| English 4+ | 91.8% | 89.5% | 89.0% | ▲ 2.3% |
| 数学 4+ | 79.5% | 75.0% | 82.1% | ▲ 4.5% |
| 人数 | ||||
| DSE Candidates | 124 | 124 | 119 | - |
Sources
Placement
AI Summary | 大学录取结果分析
结论: 2025届升学质量维持高位,英国G5及牛剑录取强势,但香港本地各梯队录取率均有所下滑。
核心要点:
- 香港本地升学承压: 香港三大录取率从58.6%降至52.4%,四大、五大及九大率均同步出现1.7%-6.2%的下跌。
- 英国方向表现极佳: 牛剑录取14人(8.3%),G5录取高达72人(42.9%),英国顶尖名校成为升学核心支柱。
- 全球顶尖名校突破: 哈耶普斯麻及藤校共录取6人,美本T20录取9人,展现了极强的高端学术竞争力。
- 中后段波动明显: 本科与副学士总率显著下降13.6%,反映出非顶尖梯队学生的升学路径或录取结果波动较大。
- 核心院校输出稳定: 帝国理工学院录取15人,虽较去年17人略减,但仍是该校英国方向最主要的顶尖去向。
专家建议:
鉴于香港本地竞争加剧,建议学生在稳固DSE成绩的同时,提前规划并加强英国G5等海外名校的多元化申请。
University Placement Analysis
| Placement Destinations | 2025Year | 2024Year | Change |
|---|---|---|---|
| Hong KongTop 3 Rate | 52.4% | 58.6% | ▼ 6.2% |
| Hong KongTop 4 Rate | 59.6% | 64.4% | ▼ 4.8% |
| Hong KongTop 5 Rate | 68.5% | 70.2% | ▼ 1.7% |
| Hong Kong九大率 | 77.4% | 79.8% | ▼ 2.4% |
| JUPAS Rate | 82.2% | 86.3% | ▼ 4.1% |
| Bachelor and Associate Degree Rate | 84.0% | 97.6% | ▼ 13.6% |
| 总本科率(本地+Overseas) | 84.0% | 86.3% | ▼ 2.3% |
| Hong Kong本地本科率 | 84.0% | 86.3% | ▼ 2.3% |
| SSSDP Rate | 5.0% | 5.6% | ▼ 0.6% |
| Self-financed Degree Rate | - | 2.4% | - |
| Higher Diploma Rate | 1.7% | - | - |
| VTC率 | - | 2.4% | - |
| Progression Rate | - | 100.0% | - |
2025 University Tier Analysis
| University Tier | 2025Enrollment25Enrollment | 2025Enrollment%25% | 2025EnrollmentCumulative%25Cumulative |
|---|---|---|---|
| Total Students | 124 | 100.0% | - |
| HK Top 3 | 65 | 52.4% | 52.4% |
| HK Top 4 | 9 | 7.3% | 59.7% |
| HK Top 5 | 11 | 8.9% | 68.5% |
Detailed University Placement Results
| University Name | 25 Matriculations25 Matric. | 25 Matric. %25 % | 24 Matriculations24 Matric. | 24 Matric. %24 % | QS | US | THE | Country |
|---|---|---|---|---|---|---|---|---|
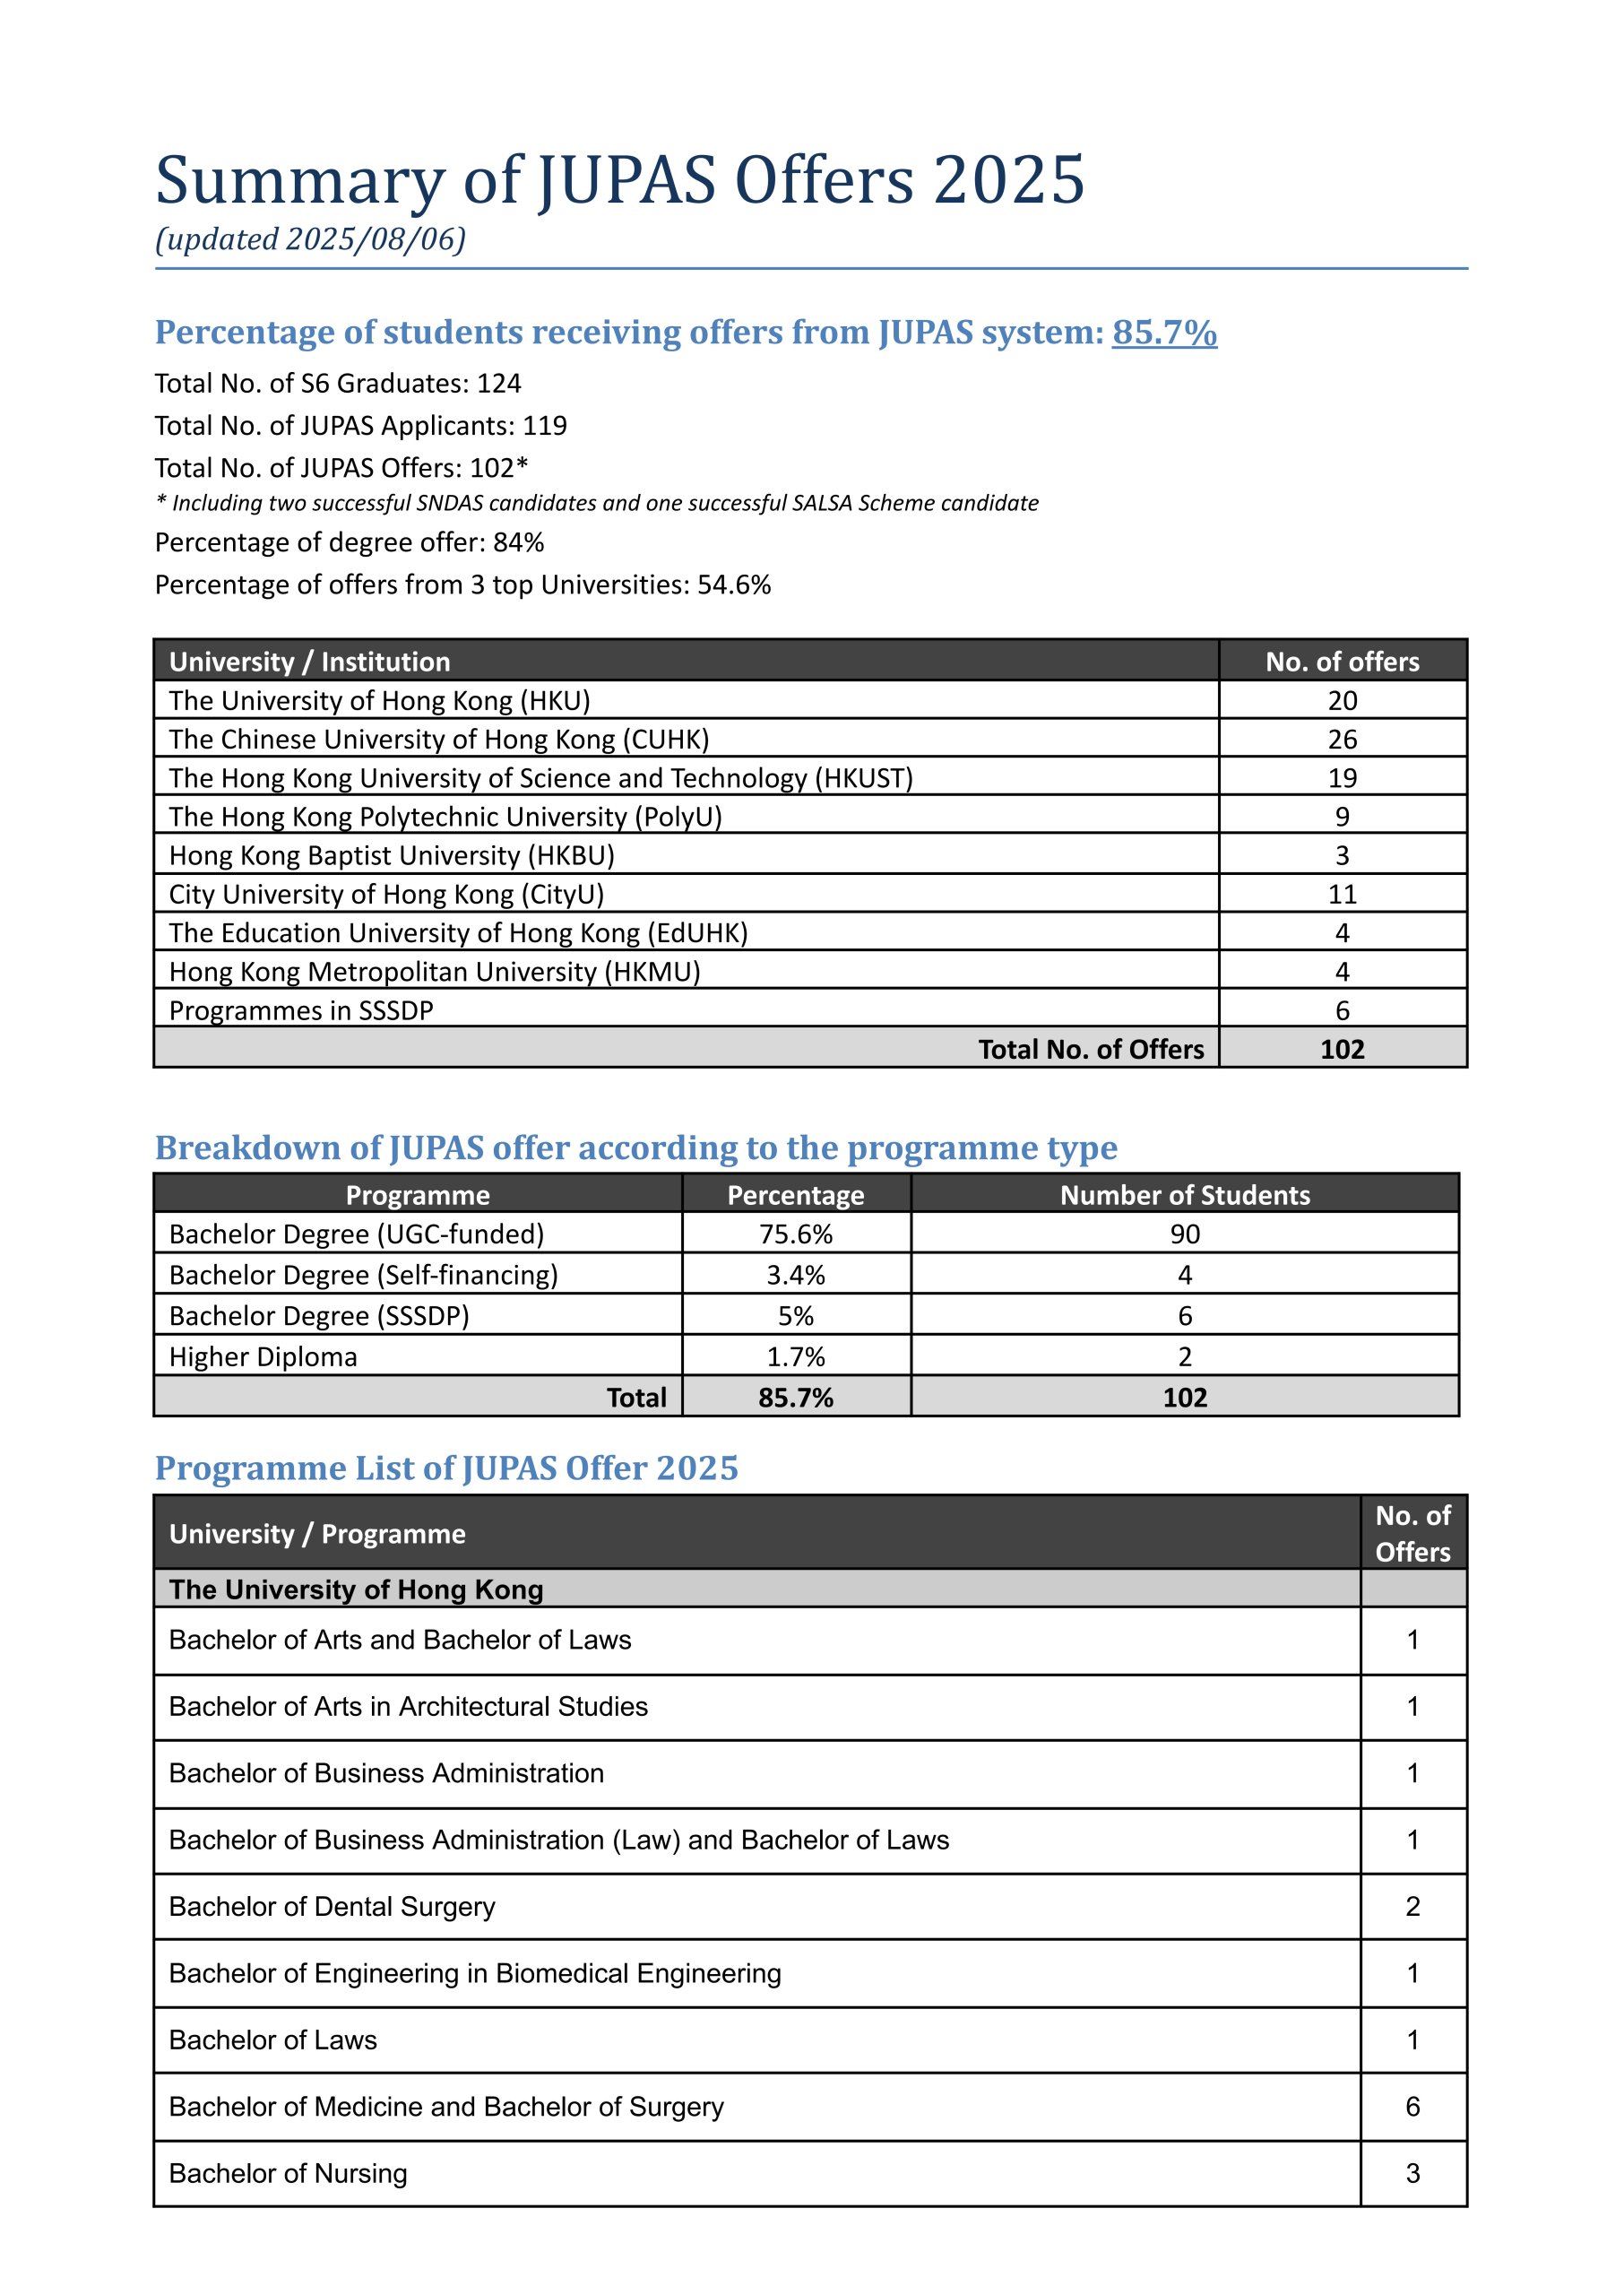
The University of Hong Kong | 20 | 19.6% | 33 | 30.8% | 11 | - | - | 中国Hong Kong |
The Chinese University of Hong Kong | 26 | 25.5% | 17 | 15.9% | 32 | - | 43 | 中国Hong Kong |
The Hong Kong University of Science and Technology | 19 | 18.6% | 19 | 17.8% | 44 | - | 60 | 中国Hong Kong |
The Hong Kong Polytechnic University | 9 | 8.8% | 15 | 14.0% | 54 | - | 80 | 中国Hong Kong |
City University of Hong Kong | 11 | 10.8% | 9 | 8.4% | 63 | - | 73 | 中国Hong Kong |
Hong Kong Baptist University | 3 | 2.9% | 4 | 3.7% | - | - | - | 中国Hong Kong |
The Education University of Hong Kong | 4 | 3.9% | - | - | - | - | - | 中国Hong Kong |
Hong Kong Metropolitan University | 4 | 3.9% | 6 | 5.6% | - | - | - | 中国Hong Kong |
Saint Francis University | - | - | 2 | 1.9% | - | - | - | 中国Hong Kong |
Others/National Service | 6 | 5.9% | 2 | 1.9% | - | - | - | Other |
Matriculation counts students who finally enroll at a university. Since each student enrolls in only one university, total matriculations usually do not exceed total graduates.
Offer counts admission offers received by students. A student may receive multiple offers, so total offers are usually higher than total graduates.
| University Name | 25 Matriculations25 Matric. | 25 Matric. %25 % | 24 Matriculations24 Matric. | 24 Matric. %24 % | QS | US | THE |
|---|---|---|---|---|---|---|---|
The University of Hong Kong | 20 | 19.6% | 33 | 30.8% | 11 | - | - |
The Chinese University of Hong Kong | 26 | 25.5% | 17 | 15.9% | 32 | - | 43 |
The Hong Kong University of Science and Technology | 19 | 18.6% | 19 | 17.8% | 44 | - | 60 |
The Hong Kong Polytechnic University | 9 | 8.8% | 15 | 14.0% | 54 | - | 80 |
City University of Hong Kong | 11 | 10.8% | 9 | 8.4% | 63 | - | 73 |
Hong Kong Baptist University | 3 | 2.9% | 4 | 3.7% | - | - | - |
The Education University of Hong Kong | 4 | 3.9% | - | - | - | - | - |
Hong Kong Metropolitan University | 4 | 3.9% | 6 | 5.6% | - | - | - |
Saint Francis University | - | - | 2 | 1.9% | - | - | - |
Sources
Living
Living & Commute Recommendations
| # | Estate | Best Commute | Commute Time | Distance | Overall Score |
|---|---|---|---|---|---|
| Loading... | |||||
Note: Monthly rent/total price are estimates based on government RVD monthly residential averages by area and size, for school-living decisions only.