
St. Paul'S Convent School
- SPCS
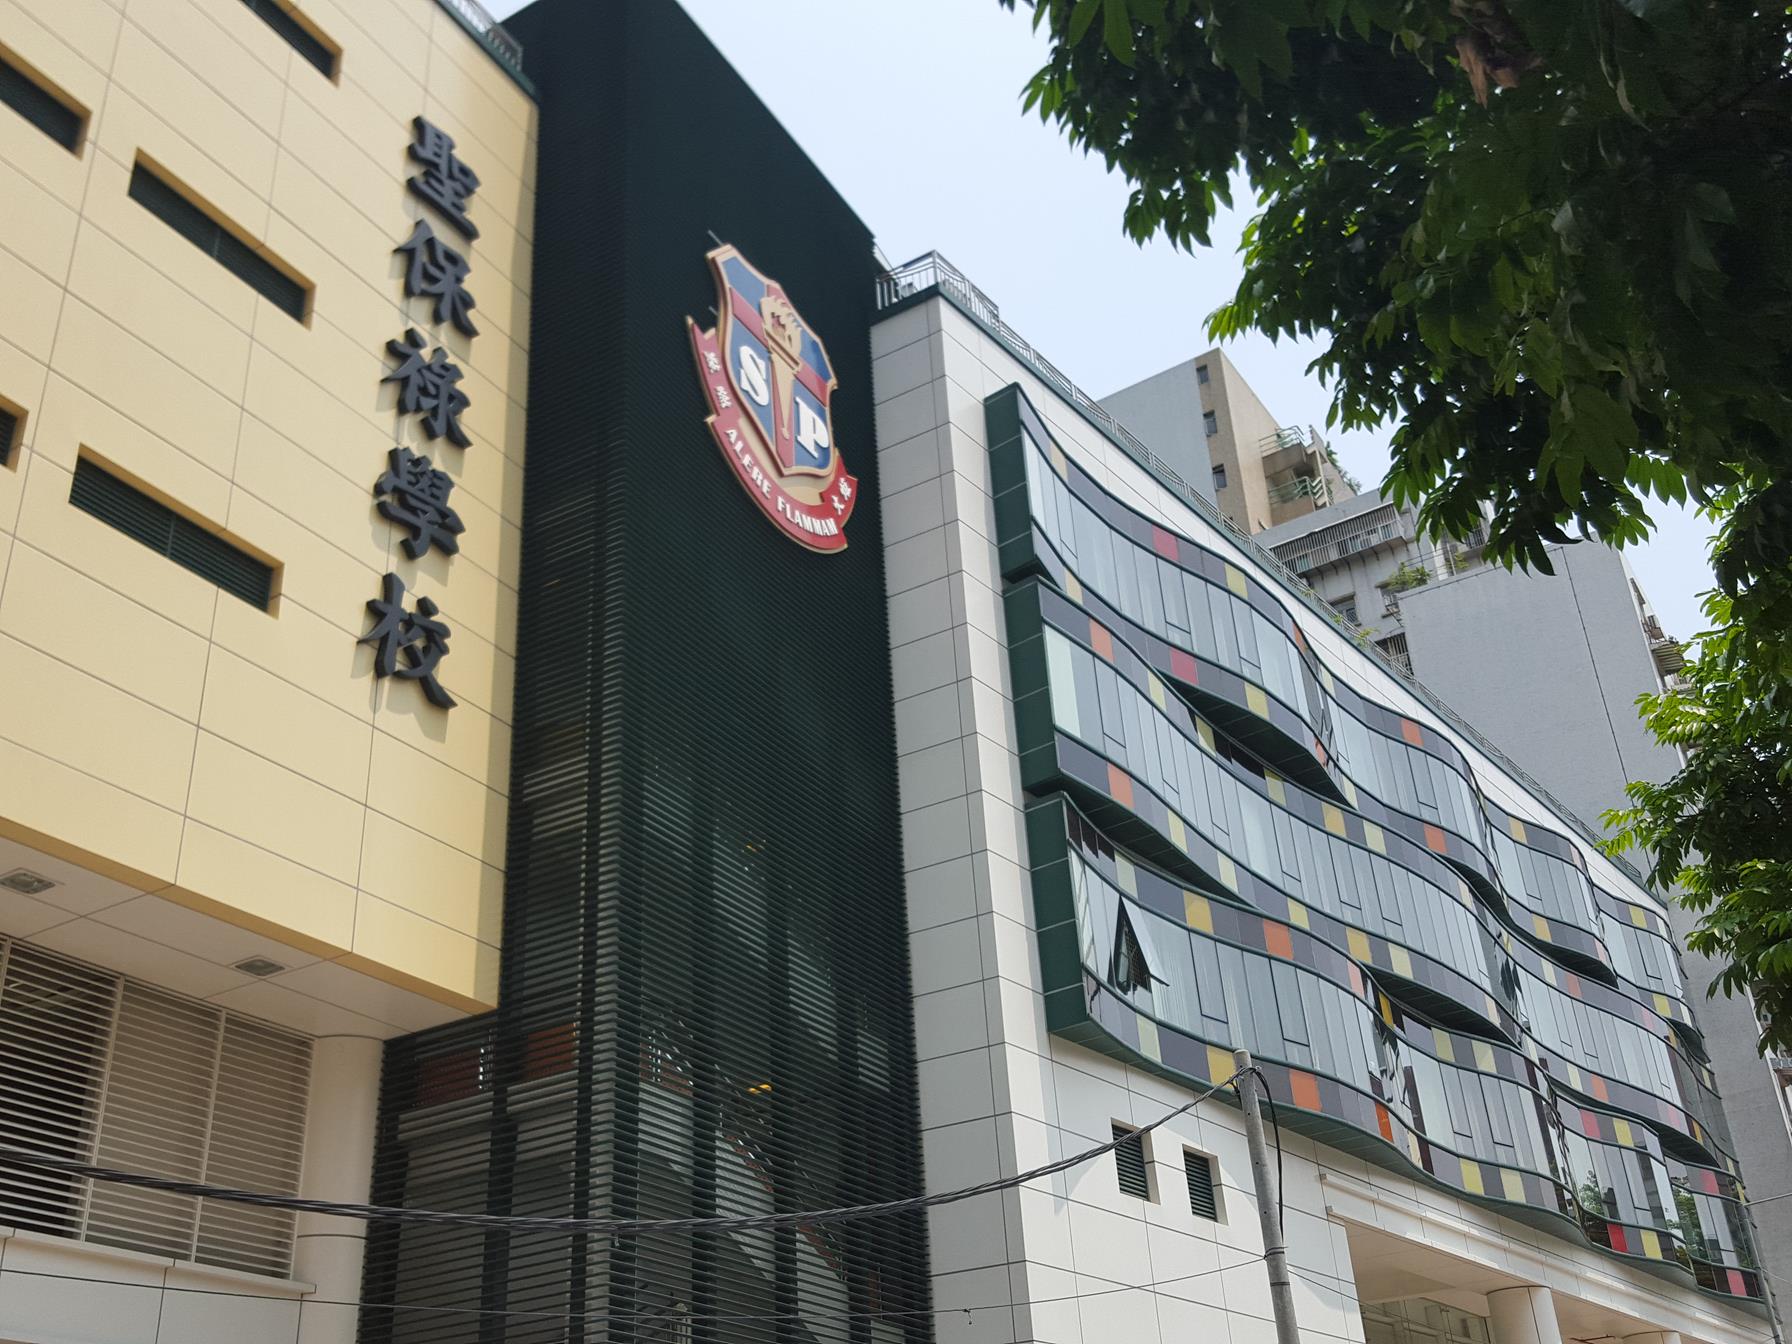
圣保禄学校(英语:St. Paul's Convent School),是香港一所天主教女子学校。该校于1900年加入香港补助学校议会22所补助学校之一。圣保禄学校创立于1854年,原名法国传道会学校,1955年易名圣保禄学校。 圣保禄学校位于香港香港岛湾仔区铜锣湾礼顿道,建筑物包括修院和教堂,在庭院中建有基督君王小堂。修院建于1914年。现在的校舍于1981年落成,由司徒惠建筑师事务所的林嘉廉设计。当时因应某地产商意图洽购有关地段兴建酒店,但为校友反对。当时有人捐了一大笔钱,用以永久购入学校所在的地段,余下的钱则用作重建校舍,使校舍从原来的欧陆式建筑变成今日的近现代建筑。
同时开始DSE和A Level课程,是全英文中学,学生英文水平高,A Level的成绩非常有突出,DSE成绩也在全港名列前茅。
Overview
Application Info
Useful Links
Contact
Map Location
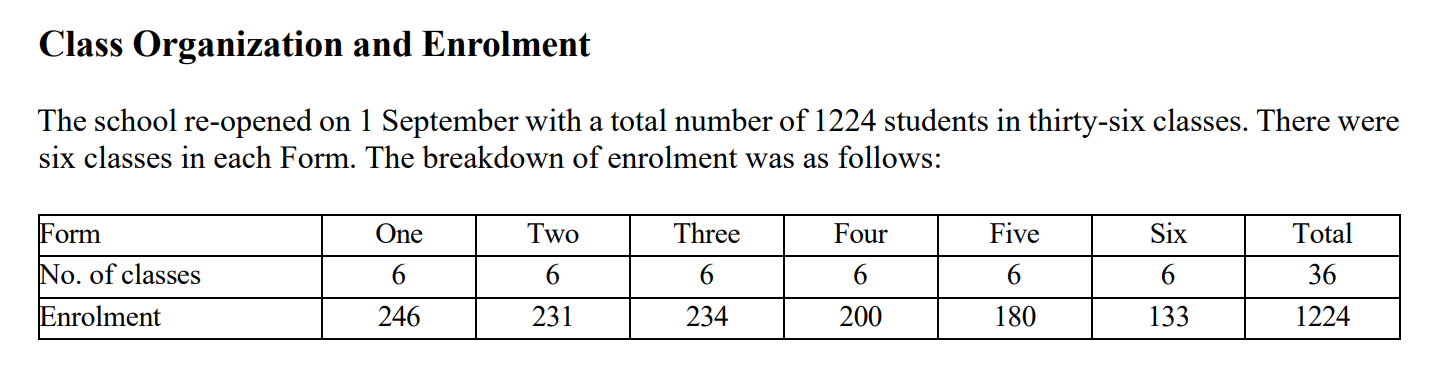
Student Distribution
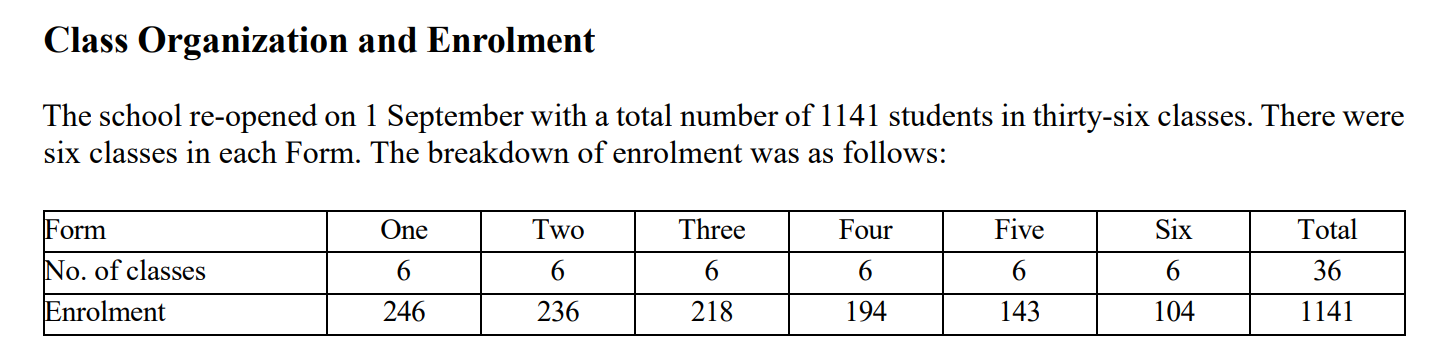
Student Enrollment Trend
| Grade | 2024-2025 | 2023-2024 | Δ Students | ||||
|---|---|---|---|---|---|---|---|
| Students | Classes | Students / Class | Students | Classes | Students / Class | ||
| S1 | 246 | 6 | 41 | 246 | 6 | 41 | - |
| S2 | 231 | 6 | 38.5 | 236 | 6 | 39.3 | ▼ 15 |
| S3 | 234 | 6 | 39 | 218 | 6 | 36.3 | ▼ 2 |
| S4 | 200 | 6 | 33.3 | 194 | 6 | 32.3 | ▼ 18 |
| S5 | 180 | 6 | 30 | 143 | 6 | 23.8 | ▼ 14 |
| S6 | 133 | 6 | 22.2 | 104 | 6 | 17.3 | ▼ 10 |
| Total | 1,224 | 36 | 34 | 1,141 | 36 | 31.7 | ▲ 83 |
Sources
Fees
Fee Information
| Grade | School Level | Age | Fees | Stage |
|---|---|---|---|---|
| G7 | S1 | 12 | $30,000 | 中一 |
| G8 | S2 | 13 | $30,000 | 中二 |
| G9 | S3 | 14 | $30,000 | 中三 |
| G10 | S4 | 15 | $32,000 | 中四 |
| G11 | S5 | 16 | $32,000 | 中五 |
| G12 | S6 | 17 | $32,000 | 中六 |
Sources

Exam
DSE Overview
| Metrics | 2025 | 2024 | Change |
|---|---|---|---|
| Level 5+ (优秀) | |||
| CEM 5+ (主科) | - | 38.1% | - |
| Chinese 5+ | - | 34.0% | - |
| English 5+ | - | 62.7% | - |
| 数学 5+ | - | 17.6% | - |
| Level 4+ (良好) | |||
| CEM 4+ (主科) | - | 76.9% | - |
| Chinese 4+ | - | 72.0% | - |
| English 4+ | - | 96.1% | - |
| 数学 4+ | - | 62.7% | - |
| Level 3+ (及格) | |||
| CEM 3+ (主科) | - | 96.7% | - |
| Chinese 3+ | - | 96.0% | - |
| English 3+ | - | 100.0% | - |
| 数学 3+ | - | 94.1% | - |
| 人数 | |||
| DSE Candidates | 63 | 104 | ▼ 41 |
| Non-DSE Candidates | 68 | 53 | ▲ 15 |
Other Exam Results
A Level Results
| Item | 2025 | 2024 | 2023 |
|---|---|---|---|
| A Level 4A* % | 38.2% |
Placement
University Placement Analysis
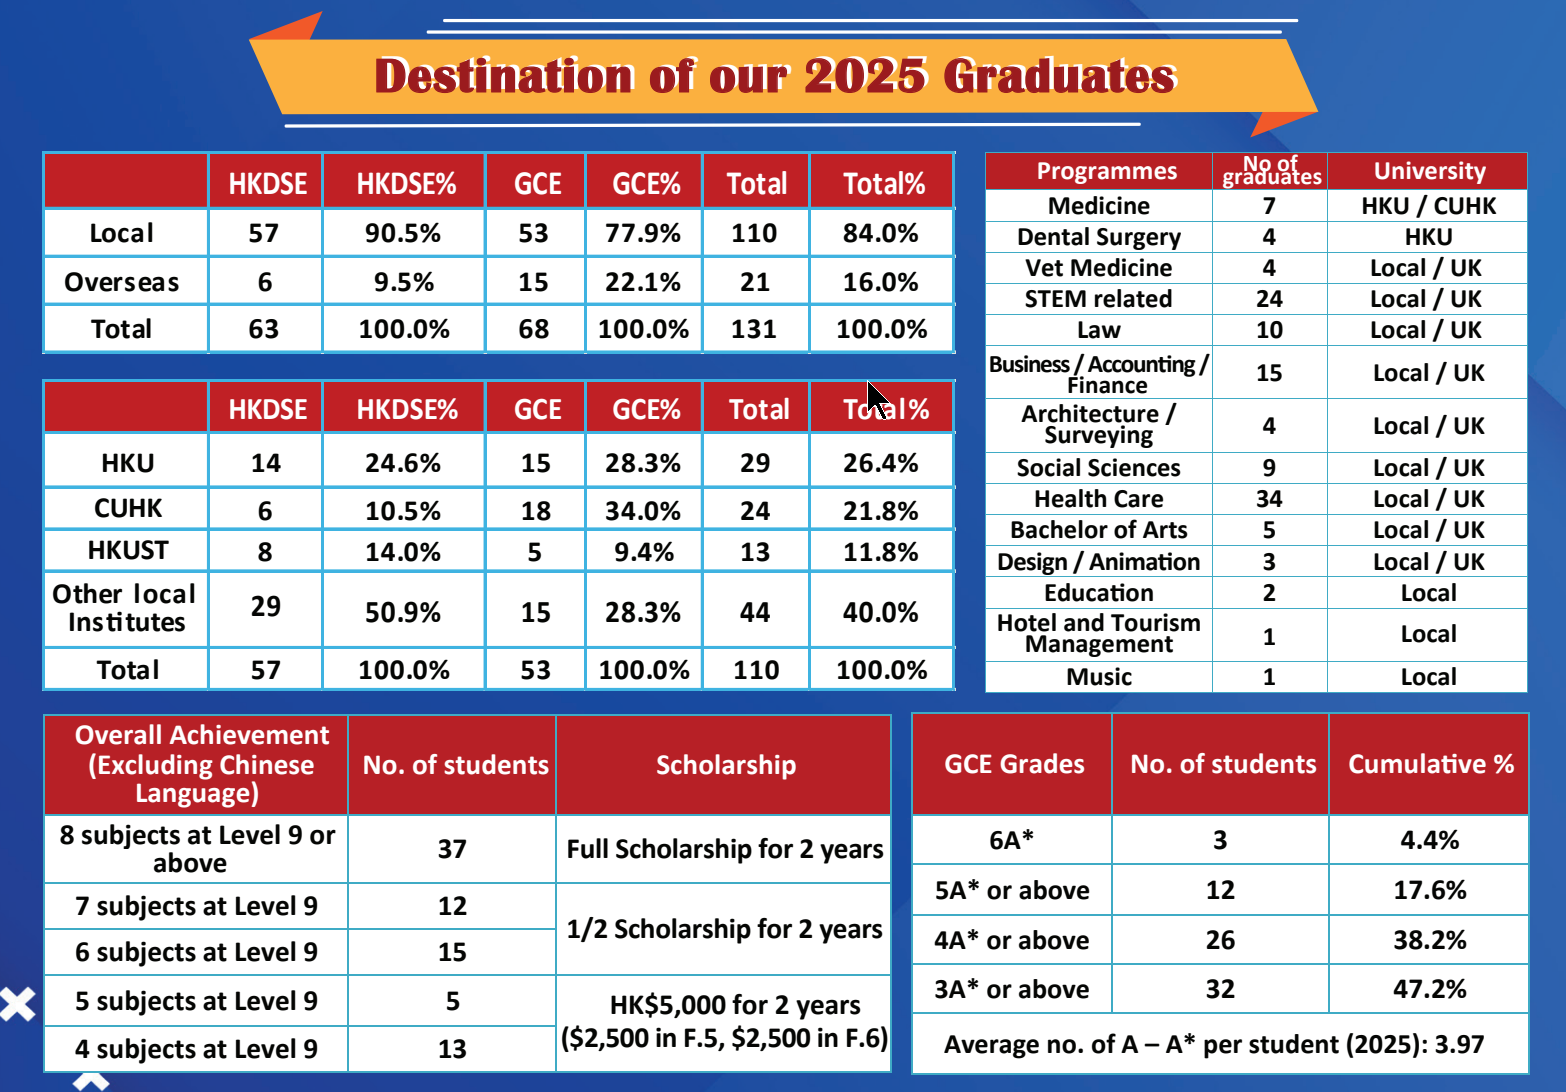
| Placement Destinations | 2025Year | 2024Year | Change |
|---|---|---|---|
| Hong KongTop 3 Rate | 50.4% | 32.9% | ▲ 17.5% |
| Hong KongTop 5 Rate | 50.4% | 45.8% | ▲ 4.6% |
| Hong Kong九大率 | 50.4% | 64.4% | ▼ 14.0% |
| JUPAS Rate | 99.9% | - | |
| Bachelor and Associate Degree Rate | 99.9% | - | |
| Hong KongTop 3 Rate | 50.4% | 96.1% | ▼ 45.7% |
| Hong Kong本地本科率 | 79.8% | - | |
| Overseas本科率 | 16.3% | - | |
| Higher Diploma Rate | 0.0% | - | |
| 副学士学位率 | 3.8% | - | |
| Progression Rate | 99.9% | - |
2025 University Tier Analysis
| University Tier | 2025Enrollment25Enrollment | 2025Enrollment%25% | 2025EnrollmentCumulative%25Cumulative |
|---|---|---|---|
| Total Students | 131 | 100.0% | - |
| HK Top 3 | 66 | 50.4% | 50.4% |
Detailed University Placement Results
| University Name | 25 Matriculations25 Matric. | 25 Matric. %25 % | QS | US | THE | Country |
|---|---|---|---|---|---|---|
The University of Hong Kong | 29 | 22.1% | 11 | - | - | 中国Hong Kong |
The Chinese University of Hong Kong | 24 | 18.3% | 32 | - | 43 | 中国Hong Kong |
The Hong Kong University of Science and Technology | 13 | 9.9% | 44 | - | 60 | 中国Hong Kong |
Others/National Service | 65 | 49.6% | - | - | - | Other |
Matriculation counts students who finally enroll at a university. Since each student enrolls in only one university, total matriculations usually do not exceed total graduates.
Offer counts admission offers received by students. A student may receive multiple offers, so total offers are usually higher than total graduates.
| University Name | 25 Matriculations25 Matric. | 25 Matric. %25 % | QS | US | THE |
|---|---|---|---|---|---|
The University of Hong Kong | 29 | 22.1% | 11 | - | - |
The Chinese University of Hong Kong | 24 | 18.3% | 32 | - | 43 |
The Hong Kong University of Science and Technology | 13 | 9.9% | 44 | - | 60 |
Sources
Living
Living & Commute Recommendations
| # | Estate | Best Commute | Commute Time | Distance | Overall Score |
|---|---|---|---|---|---|
| Loading... | |||||
Note: Monthly rent/total price are estimates based on government RVD monthly residential averages by area and size, for school-living decisions only.