

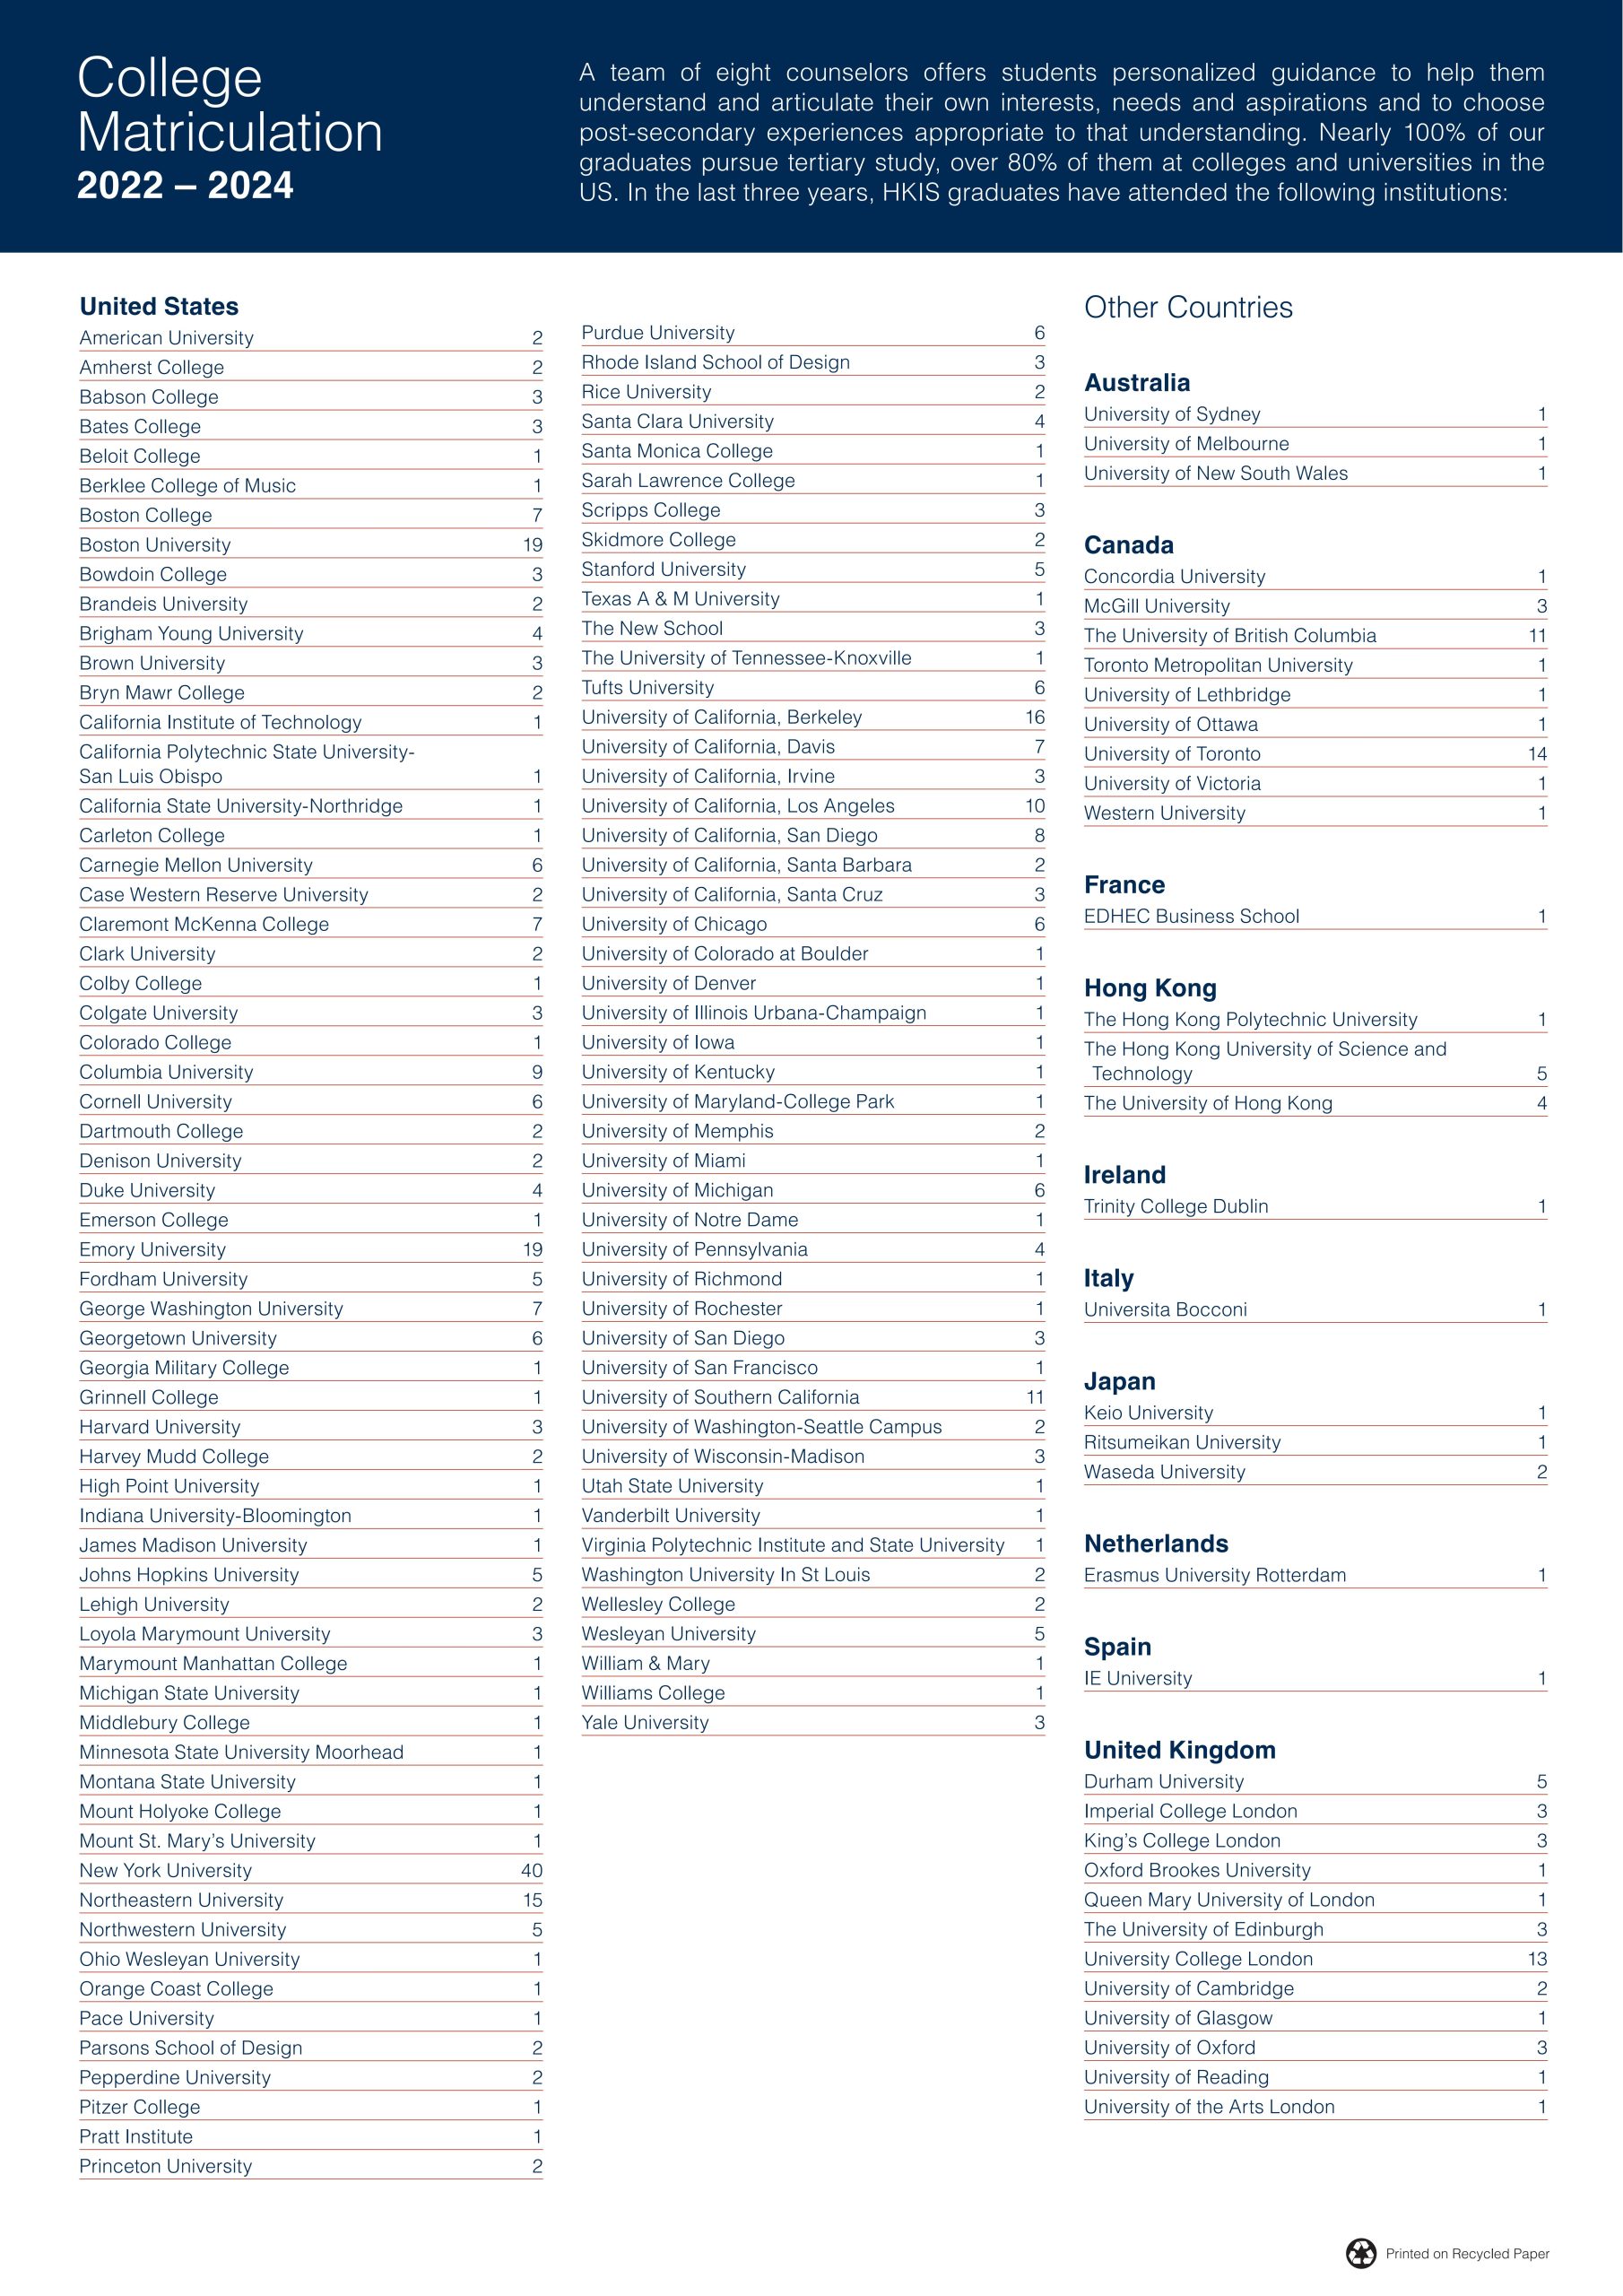
HONG KONG INTERNATIONAL SCHOOL
- HKIS
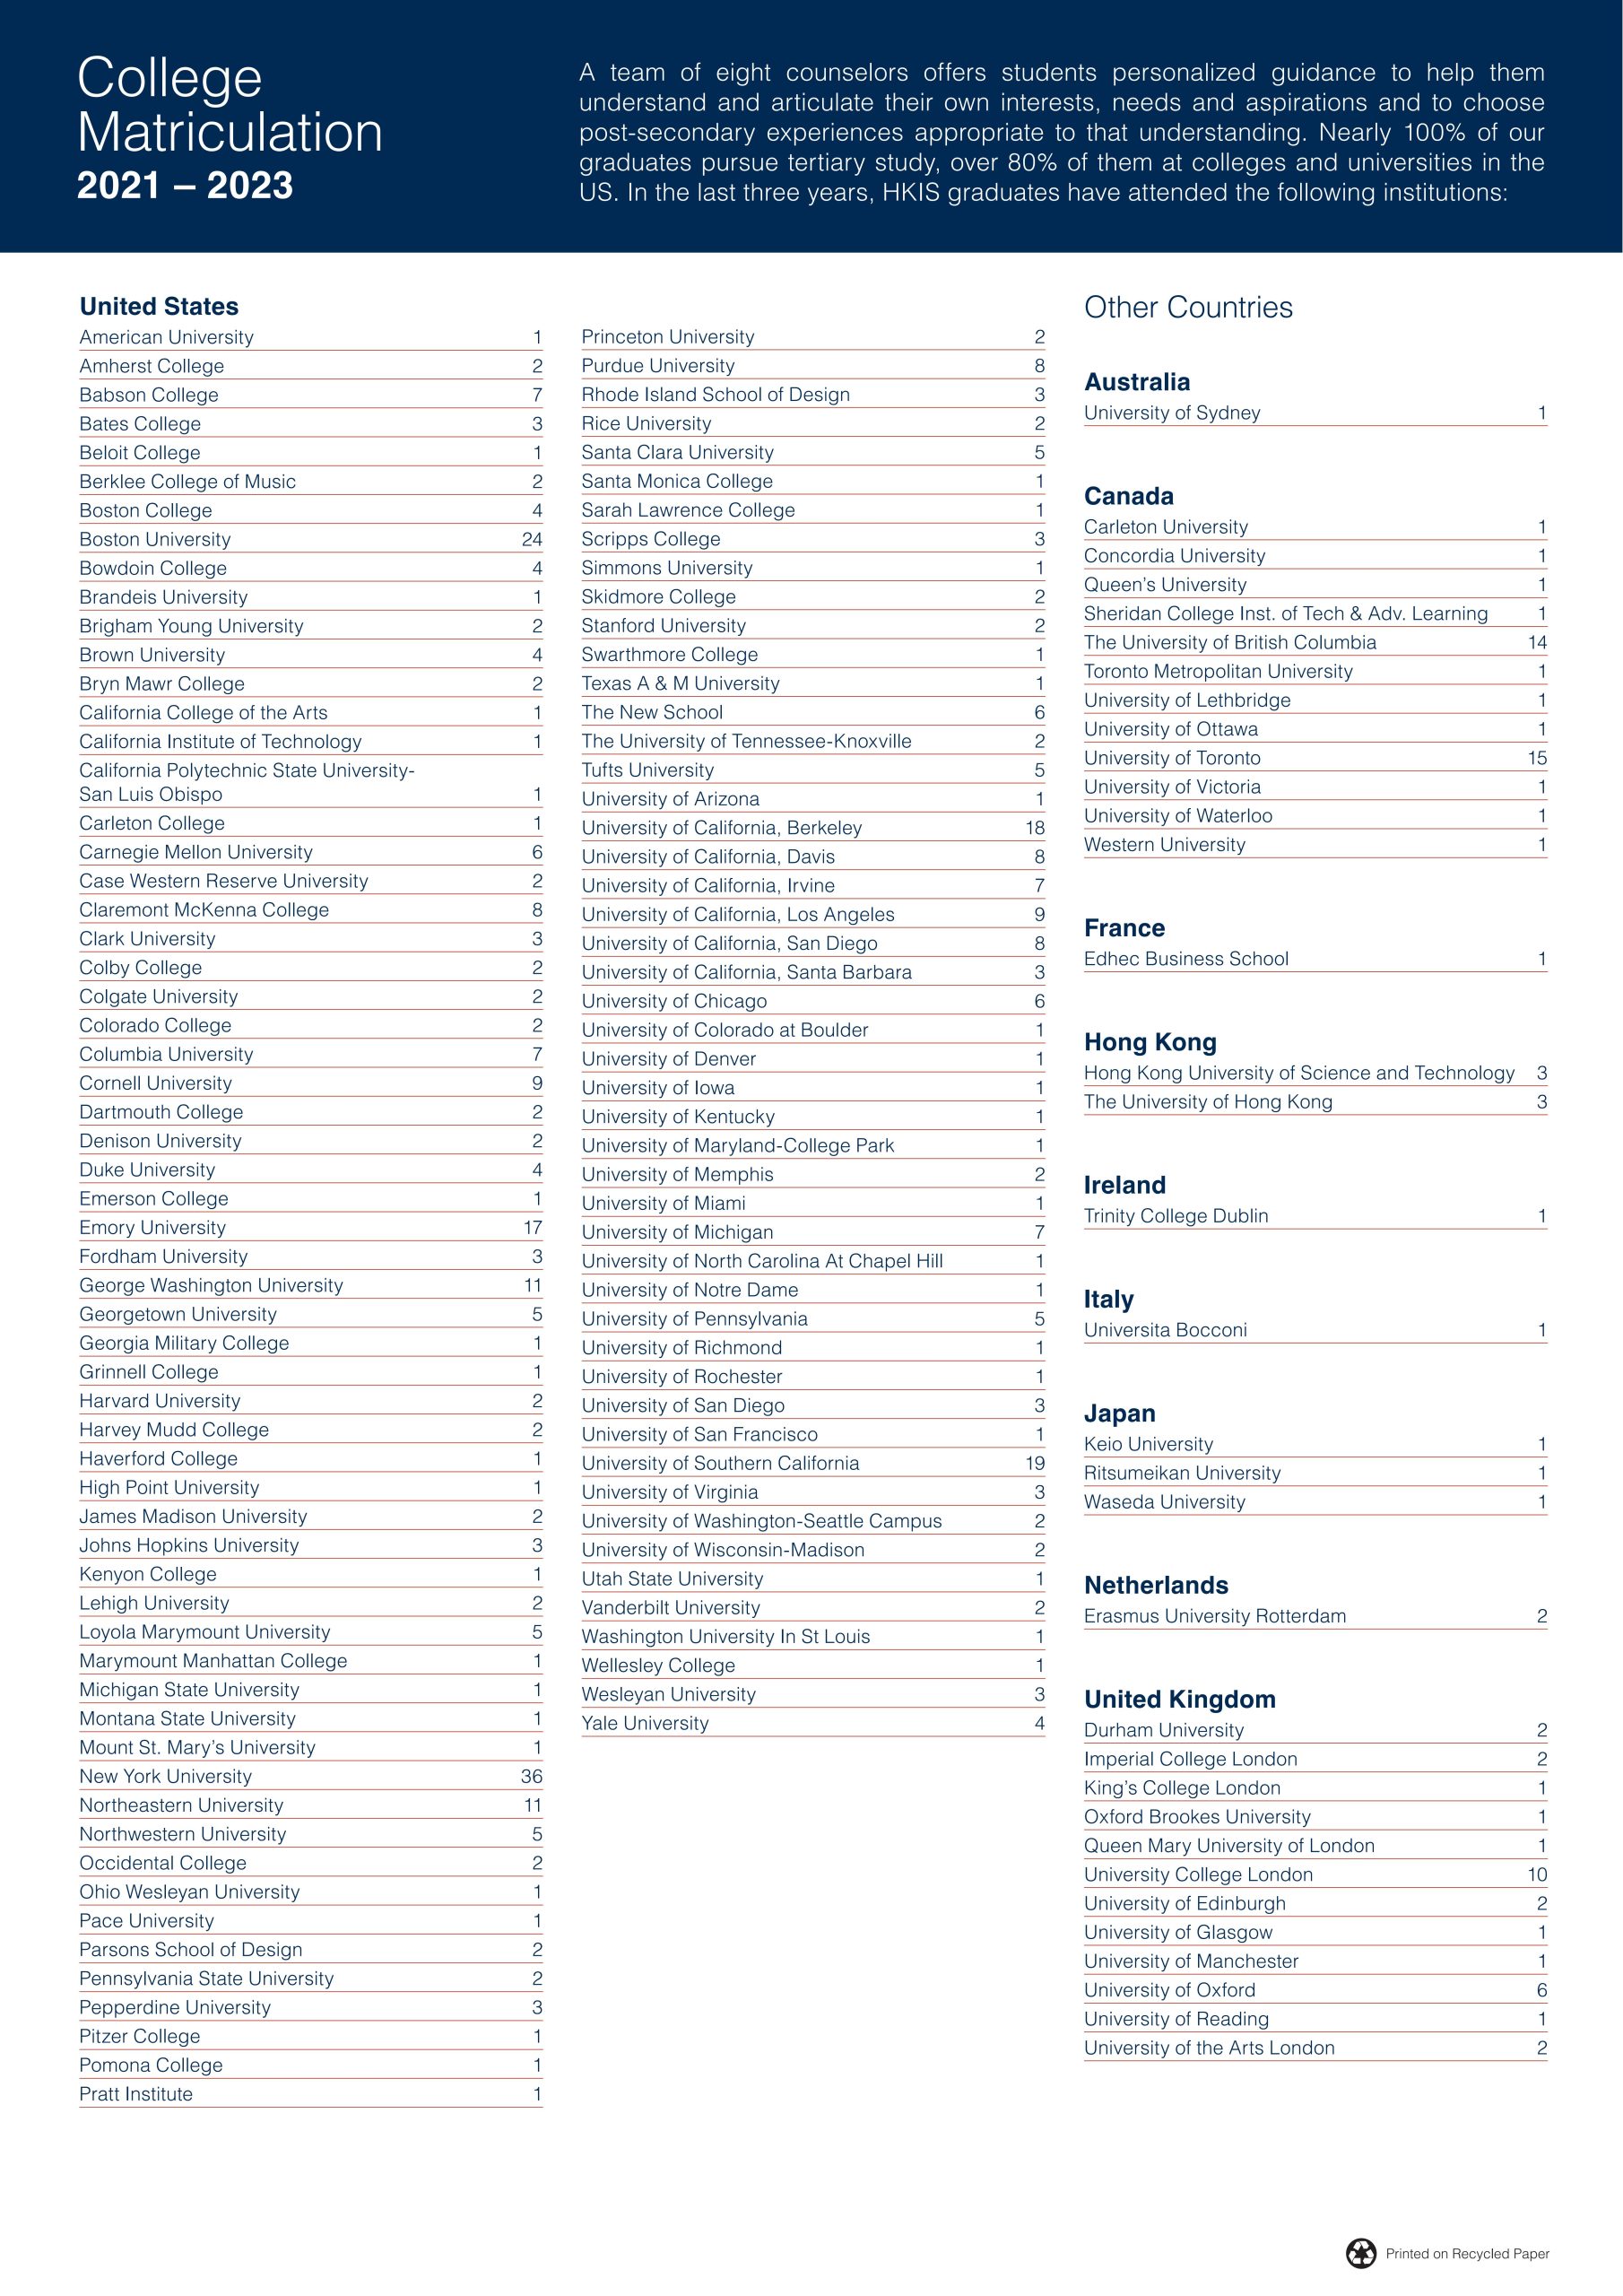
The Hong Kong International School is the most famous and outstanding American system of international schools in Hong Kong. It adopts the American curriculum, with AP and SAT or ACT as entry exams for university admission. The number of graduates each year exceeds 150, and over 80% of them go to America. Among those who are admitted to America's top 20 or 30 universities, a large majority are from Hong Kong. The Hong Kong International School is an excellent choice for students who love sports and plan to study at American universities in the future.
The school with the highest admission rate in Hong Kong is the International School of American Schools (IAS). It has the most students from top 30 universities and the most students from American colleges.
Overview
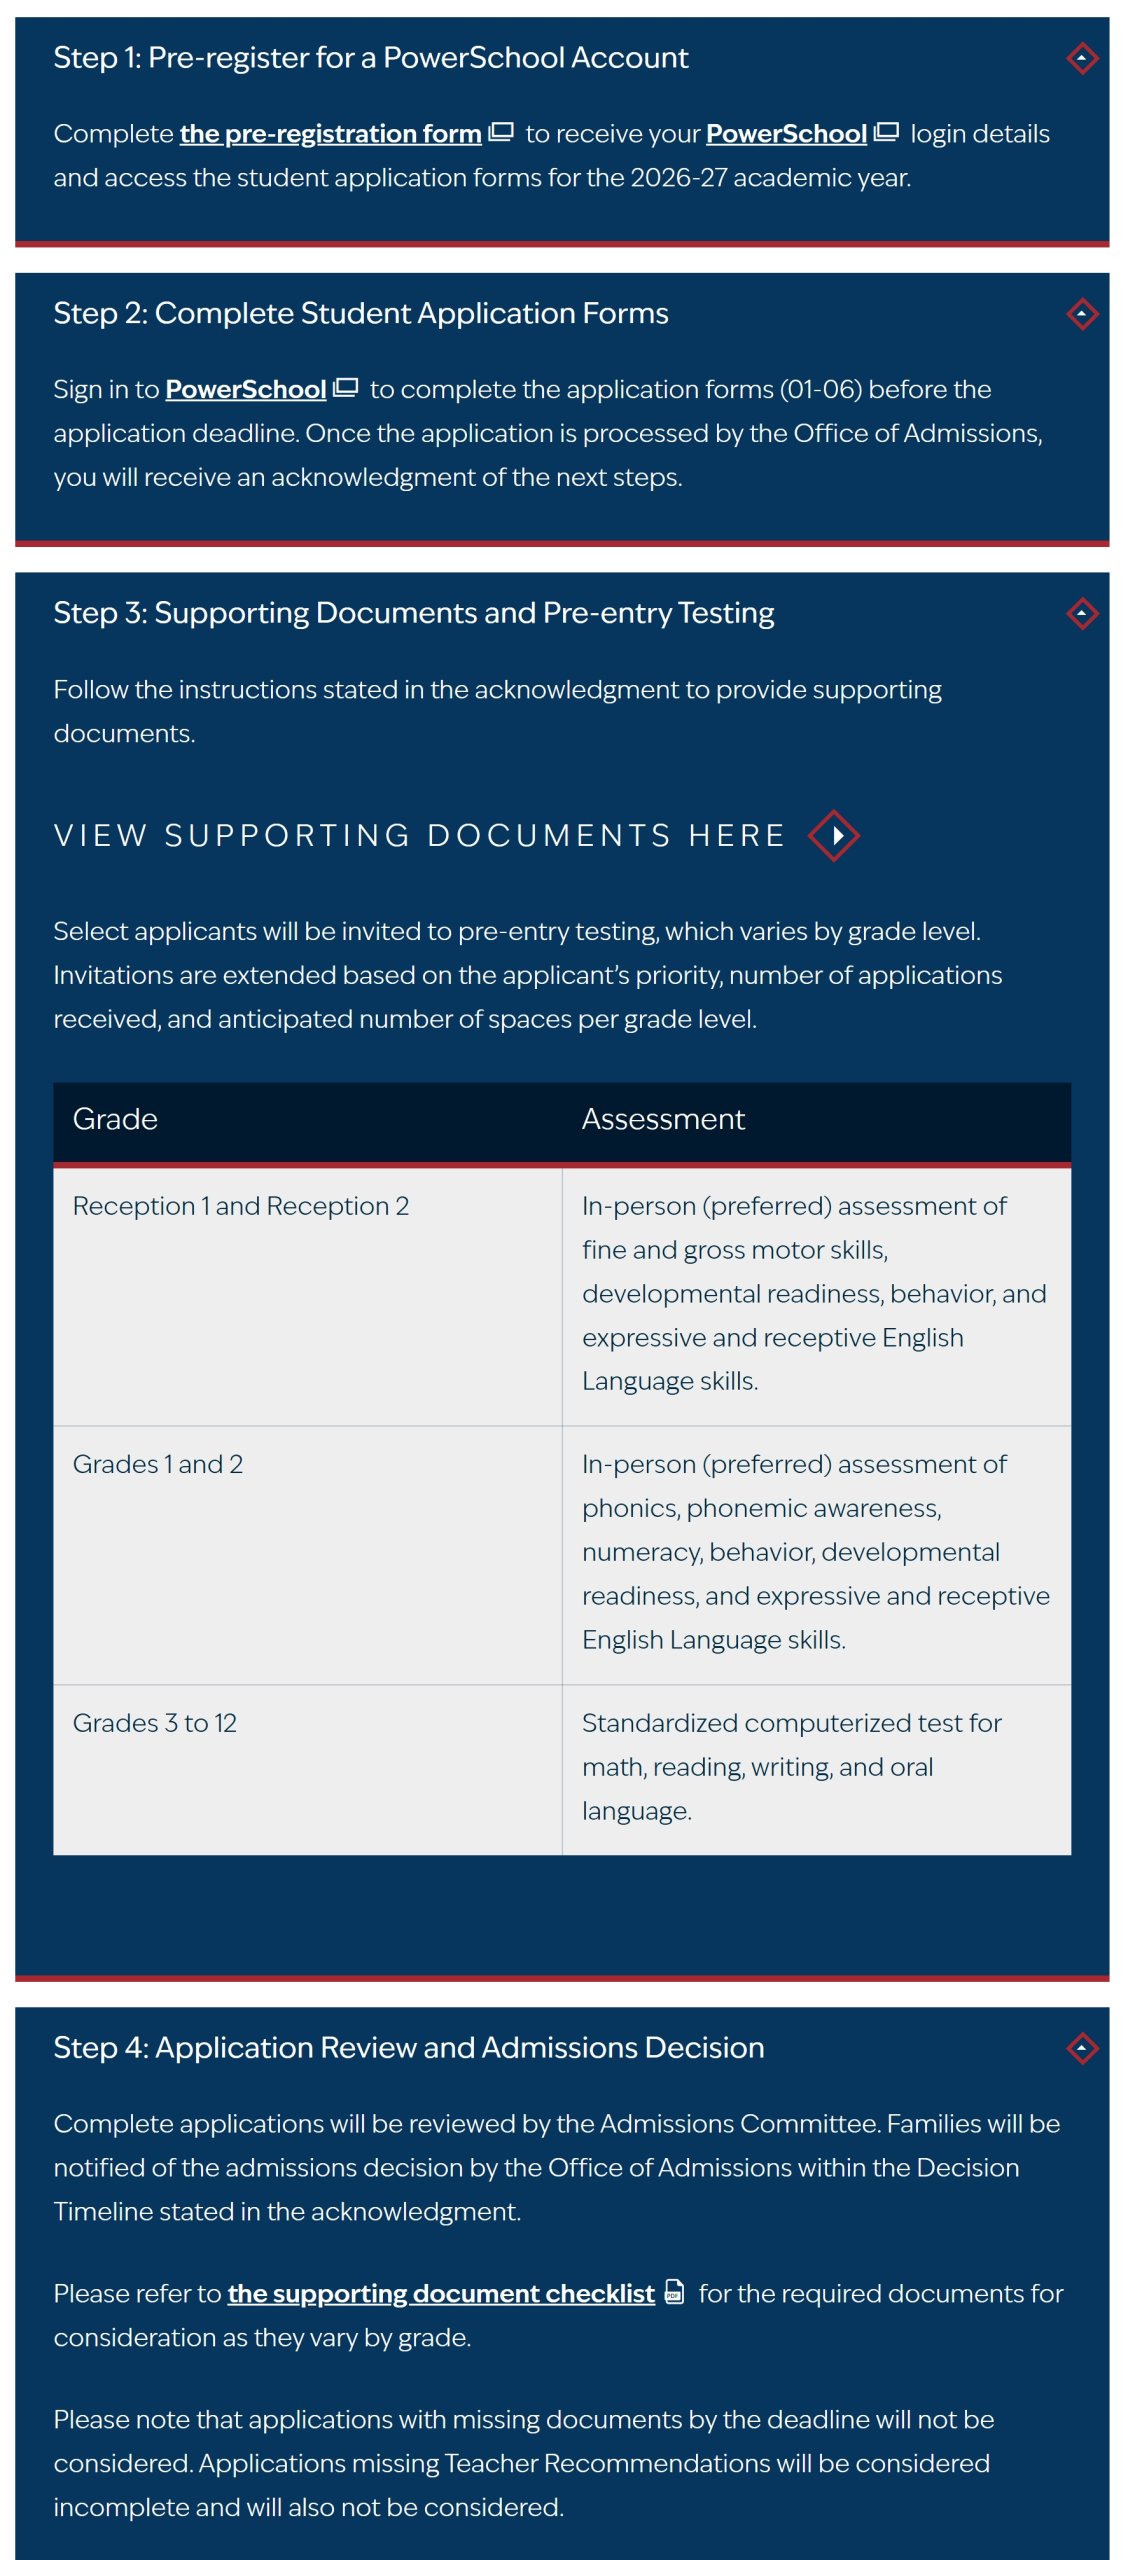
Application Info
School Documents
Useful Links
Contact
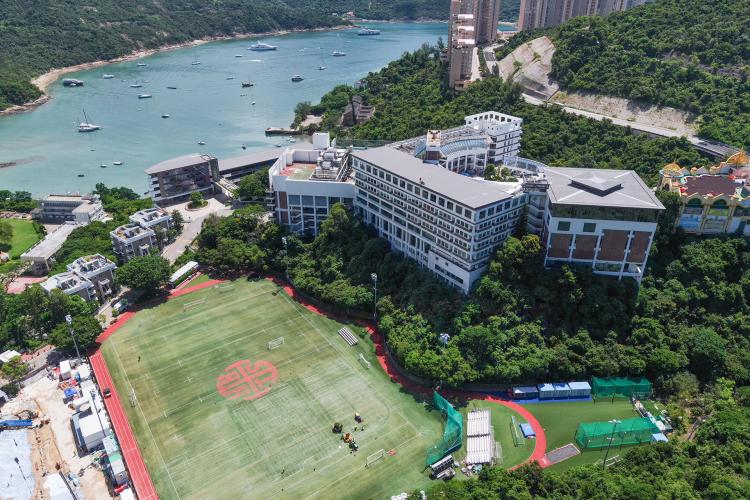
Secondary School: 1 Red Hill Road, Tai Tam, Hong Kong
Map Location
Fees
香港国际学校的学费水平处于全港顶尖梯队,采取“无强制债券、设有高额自愿提名权”的财务政策。
- 学费排名:在全港98所学校中位列第16名,排名高于香港加拿大国际学校,略低于香港美国学校。
- 建校费用:学生需缴纳每年11,500港元的建校费,该项费用是学费之外明确列出的主要额外支出。
- 债券政策:学校不设强制性购买的债券,且明确标注不需要购买常规的可退还或不可退还债券。
- 提名权计划:提供价值300万港元的提名权债券供自愿购买,该债券在锁定15年后可获无息退还。
建议:申请家庭需重点评估300万港元提名权的资金占用成本,并建议向校方核实建校费的最新缴纳频率。
2025-2026 Fee Information
| Grade | School Level | Age | Fees | Capital Levy | Annual Expenditure | Stage |
|---|---|---|---|---|---|---|
| K2 | R1 | 4 | $224,800 | $11,500 | $236,300 | Kindergarten |
| K3 | R2 | 5 | $224,800 | $11,500 | $236,300 | Kindergarten |
| G1 | G1 | 6 | $224,800 | $11,500 | $236,300 | Primary |
| G2 | G2 | 7 | $224,800 | $11,500 | $236,300 | Primary |
| G3 | G3 | 8 | $224,800 | $11,500 | $236,300 | Primary |
| G4 | G4 | 9 | $224,800 | $11,500 | $236,300 | Primary |
| G5 | G5 | 10 | $224,800 | $11,500 | $236,300 | Primary |
| G6 | G6 | 11 | $236,200 | $11,500 | $247,700 | Lower Secondary |
| G7 | G7 | 12 | $236,200 | $11,500 | $247,700 | Lower Secondary |
| G8 | G8 | 13 | $236,200 | $11,500 | $247,700 | Lower Secondary |
| G9 | G9 | 14 | $245,100 | $11,500 | $256,600 | Upper Secondary AP |
| G10 | G10 | 15 | $245,100 | $11,500 | $256,600 | Upper Secondary AP |
| G11 | G11 | 16 | $263,300 | $11,500 | $274,800 | Upper Secondary AP |
| G12 | G12 | 17 | $263,300 | $11,500 | $274,800 | Upper Secondary AP |
Note: Capital levy in the table is payable annually. Annual expenditure = annual tuition + annual capital levy.
Other Fees
Sources


Exam
SAT总分连续三年呈下降趋势,2025年1380分较2023年下降50分。
- SAT英文阅读和写作:2025年实际分690,较2024/2023年的700分下降10分,处于640-740区间中偏下位置。
- SAT数学:2025年690分,较2024年下降30分、较2023年下降40分,降幅最明显,已跌至630-760区间的下半段。
- ACT总分:2025年34分,较2024年35分下降1分,但较2023年34分持平,整体保持高位稳定。
- ACT各科2025年得分集中在34-35,波动较小,科学科目35分表现相对突出。
- GPA分布:2025年3.80-4.00区间占比30.15%,较2024年40.64%明显下降,高分段比例缩减。
建议重点针对数学进行系统补强(尤其是2025年下降幅度最大),同时维持ACT和GPA高位稳定,以提升综合竞争力。
Other Exam Results
SAT Results
| Item | 2025 | 2024 | 2023 |
|---|---|---|---|
| SAT - Reading and Writing | 640-740 | 690 | 670-750 | 700 | 650-740 | 700 |
| SAT - Math | 630-760 | 690 | 670-790 | 720 | 630-780 | 730 |
| SAT - Total Score | 1380 | 1420 | 1430 |
ACT Results
| Item | 2025 | 2024 | 2023 |
|---|---|---|---|
| ACT - Reading | 34-34 | 34 | 35-36 | 35 | 32-33 | 33 |
| ACT - Science | 35-36 | 35 | 36-36 | 36 | 31-36 | 33 |
| ACT - Math | 34-36 | 34 | 35-36 | 35 | 32-36 | 35 |
| ACT - English | 33-36 | 34 | 36-36 | 36 | 35-35 | 35 |
| ACT - Composite Score | 34-36 | 34 | 35-36 | 35 | 33-35 | 34 |
GPA Results
| Item | 2025 | 2024 | 2023 |
|---|---|---|---|
| GPA %: 3.80-4.00 | 30.15% | 40.64% | 35.67% |
| GPA %: 3.60-3.79 | 36.68% | 28.34% | 34.39% |
| GPA %: 3.40-3.59 | 21.11% | 18.18% | 15.92% |
| GPA %: 3.20-3.39 | 8.54% | 8.56% | 10.83% |
| GPA %: Below 3.20 | 3.52% | 4.28% | 3.19% |
Placement
该校2025年大学录取整体排名第3/31,留学目的地以美国为主导,占比稳定在80%左右。
- 美国录取人数392人(占比80.0%),较2024年389人(80.7%)略降0.7个百分点,仍保持绝对主导地位。
- 英国录取人数30人(6.1%),较2024年37人(7.7%)下降1.6个百分点,降幅最大。
- 加拿大录取人数38人(7.8%),较2024年34人(7.1%)上升0.7个百分点,呈现小幅增长。
- 澳大利亚录取6人(1.2%)、欧洲8人(1.6%),均较2024年增加0.6个百分点,多元化趋势略有增强。
- 香港录取11人(2.2%),较2024年微增0.2个百分点,保持稳定。
- 总录取人数490人,较2024年482人小幅增加,整体升学规模稳中有升。
建议关注英国方向申请竞争力下滑趋势,可适当加大加拿大、澳大利亚等备选目的地资源投入。
2025 Study-abroad Country Analysis
23-25Enrollment
22-24Enrollment
| Country/Region | 23-25Enrollment | Share | 22-24Enrollment | Share | Change |
|---|---|---|---|---|---|
| United States | 392 | 80.0% | 389 | 80.7% | ↓ 0.7% |
| United Kingdom | 30 | 6.1% | 37 | 7.7% | ↓ 1.6% |
| Hong Kong | 11 | 2.2% | 10 | 2.1% | ↑ 0.2% |
| Canada | 38 | 7.8% | 34 | 7.1% | ↑ 0.7% |
| Australia | 6 | 1.2% | 3 | 0.6% | ↑ 0.6% |
| Europe | 8 | 1.6% | 5 | 1.0% | ↑ 0.6% |
| Asia | 4 | 0.8% | 4 | 0.8% | - |
| Other | 1 | 0.2% | - | - | ↑ 0.2% |
| Total | 490 | 100.0% | 482 | 100.0% | - |
2025 University Tier Analysis
| University Tier | 23-25Annual AverageEnrollment25Enrollment | 23-25Annual AverageEnrollment%25% | 23-25Annual AverageEnrollmentCumulative%25Cumulative | 22-24Annual AverageEnrollment24Enrollment | 22-24Annual AverageEnrollment%24% | 22-24Annual AverageEnrollmentCumulative%24Cumulative | ΔOffers%Δ% |
|---|---|---|---|---|---|---|---|
| Total Students | 163 | 100.0% | - | 161 | 100.0% | - | - |
| HYPSM | 4 | 2.4% | - | 4 | 2.7% | - | -0.2% |
| Ivy League | 11 | 6.9% | - | 11 | 6.6% | - | +0.3% |
| US Top 10 | 14 | 8.6% | 8.6% | 12 | 7.7% | 7.7% | +0.9% |
| US Top 20 | 24 | 14.9% | 23.5% | 22 | 13.5% | 21.2% | +1.4% |
| UK Oxbridge | 1 | 0.8% | 24.3% | 2 | 1.0% | 22.2% | -0.2% |
| US Top 30 | 16 | 9.8% | 34.1% | 15 | 9.1% | 31.3% | +0.7% |
| UK G5 | 5 | 2.9% | 36.9% | 5 | 3.3% | 34.6% | -0.5% |
| HK Top 3 | 3 | 2.0% | 39.0% | 3 | 1.9% | 36.5% | +0.2% |
| Liberal Arts Top 10 | 7 | 4.1% | 43.1% | 8 | 5.0% | 41.5% | -0.9% |
| US Top 50 | 42 | 25.5% | 68.6% | 38 | 23.9% | 65.4% | +1.7% |
| HK Top 4 | 0 | 0.2% | 68.8% | 0 | 0.2% | 65.6% | 0.0% |
| Canada Top 3 | 11 | 6.9% | 75.7% | 9 | 5.8% | 71.4% | +1.1% |
| Asia Top | 0 | 0.2% | 75.9% | - | - | 71.4% | +0.2% |
| Liberal Arts Top 20 | 3 | 1.8% | 77.8% | 2 | 1.5% | 72.8% | +0.4% |
| UK Top 10 | 2 | 1.0% | 78.8% | 2 | 1.2% | 74.1% | -0.2% |
| QS Top 100 | 2 | 1.2% | 80.0% | 2 | 1.5% | 75.5% | -0.2% |
| US Top 100 | 9 | 5.5% | 85.5% | 11 | 7.1% | 82.6% | -1.5% |
| US Top 100+ | 7 | 4.3% | 89.8% | 9 | 5.4% | 88.0% | -1.1% |
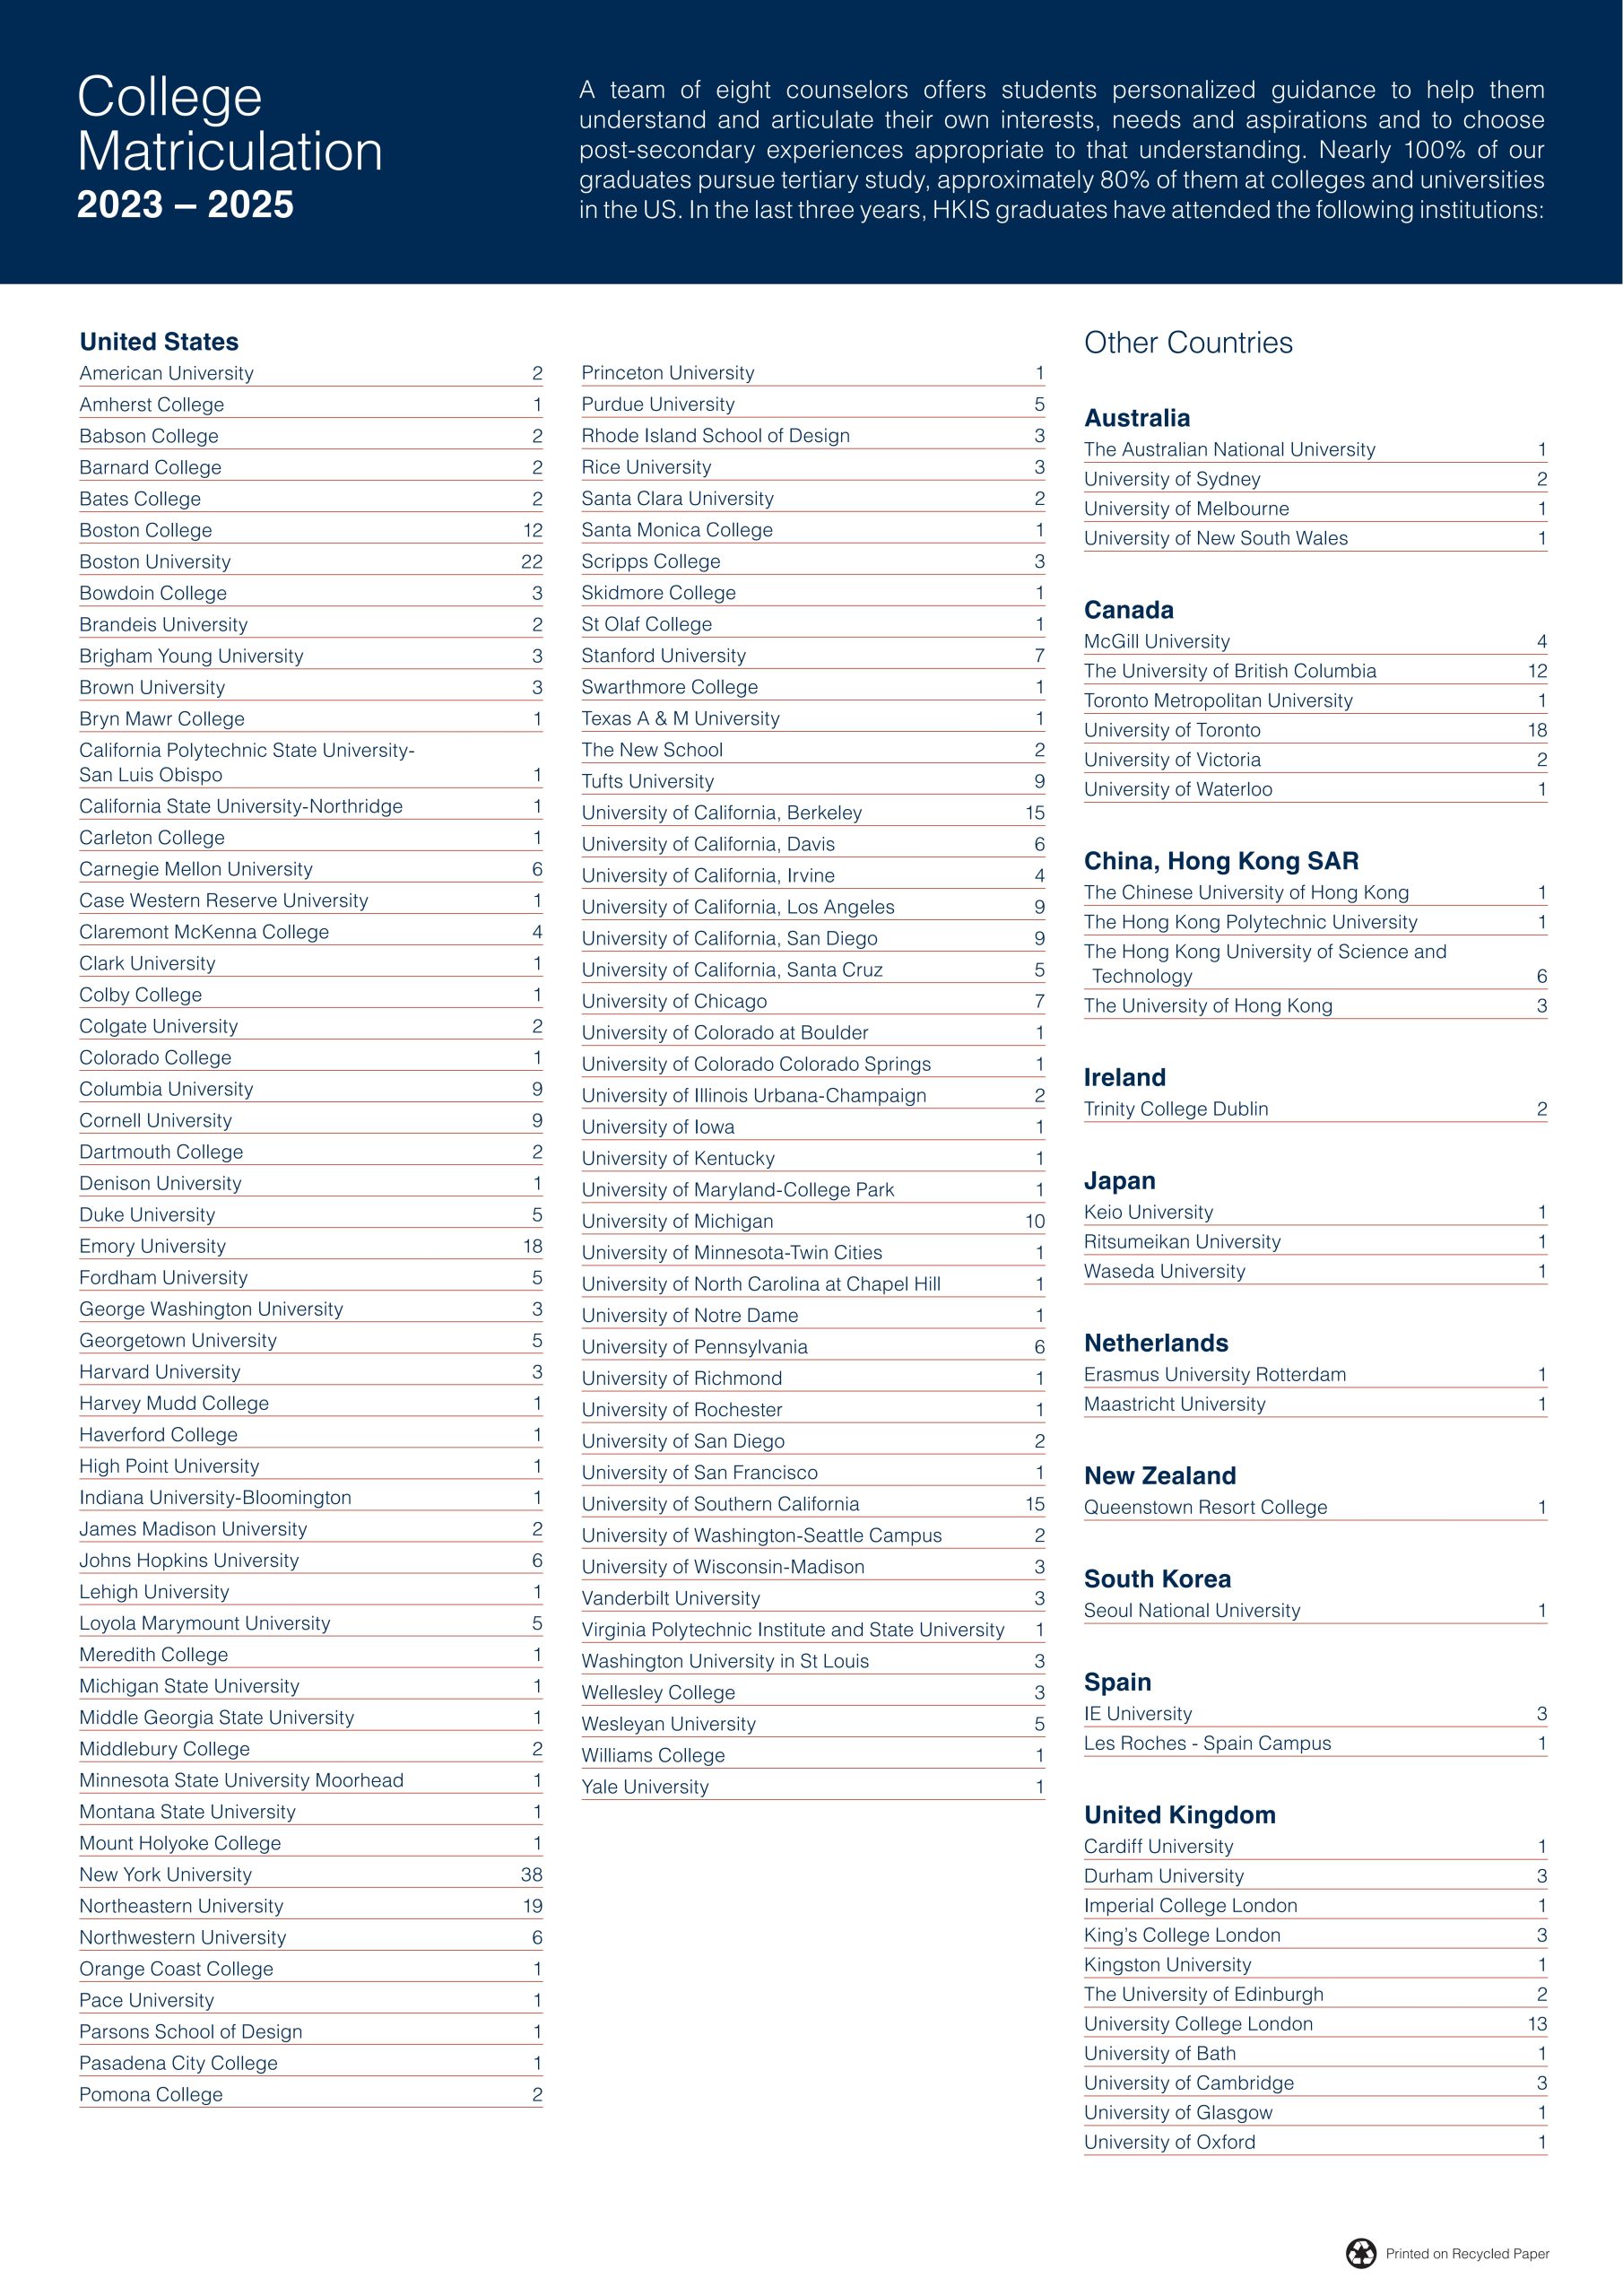
2023-2025 Detailed University Placement Results
| University Name | 23-25 avg Matriculations23-25 avg Matric. | 23-25 avg Matric. %23-25 avg % | 22-24 avg Matriculations22-24 avg Matric. | 22-24 avg Matric. %22-24 avg % | QS | US | THE | Country |
|---|---|---|---|---|---|---|---|---|
Imperial College London | 0.3 | 0.2% | 1.0 | 0.6% | 2 | - | 8 | United Kingdom |
University of Oxford | 0.3 | 0.2% | 1.0 | 0.6% | 4 | - | 1 | United Kingdom |
University of Cambridge | 1.0 | 0.6% | 0.7 | 0.4% | 6 | - | 4 | United Kingdom |
University College London | 4.3 | 2.7% | 4.3 | 2.7% | 9 | - | - | United Kingdom |
The University of Hong Kong | 1.0 | 0.6% | 1.3 | 0.8% | 11 | - | - | 中国Hong Kong |
King's College London | 1.0 | 0.6% | 1.0 | 0.6% | 31 | - | - | United Kingdom |
The Chinese University of Hong Kong | 0.3 | 0.2% | - | - | 32 | - | 43 | 中国Hong Kong |
University of Edinburgh | 0.7 | 0.4% | 1.0 | 0.6% | 34 | - | 29 | United Kingdom |
The Hong Kong University of Science and Technology | 2.0 | 1.2% | 1.7 | 1.0% | 44 | - | 60 | 中国Hong Kong |
The Hong Kong Polytechnic University | 0.3 | 0.2% | 0.3 | 0.2% | 54 | - | 80 | 中国Hong Kong |
University of Glasgow | 0.3 | 0.2% | 0.3 | 0.2% | 79 | - | 84 | United Kingdom |
Durham University | 1.0 | 0.6% | 1.7 | 1.0% | 94 | - | 175 | United Kingdom |
Others/National Service | 0.3 | 0.2% | - | - | - | - | - | Other |
Queen Mary University of London | - | - | 0.3 | 0.2% | - | - | 134 | United Kingdom |
University of Bath | 0.3 | 0.2% | - | - | - | - | - | United Kingdom |
Cardiff University | 0.3 | 0.2% | - | - | - | - | - | United Kingdom |
University of Reading | - | - | 0.3 | 0.2% | - | - | - | United Kingdom |
Oxford Brookes University | - | - | 0.3 | 0.2% | - | - | - | United Kingdom |
Kingston University | 0.3 | 0.2% | - | - | - | - | - | United Kingdom |
University of the Arts London | - | - | 0.3 | 0.2% | - | - | - | United Kingdom |
Matriculation counts students who finally enroll at a university. Since each student enrolls in only one university, total matriculations usually do not exceed total graduates.
Offer counts admission offers received by students. A student may receive multiple offers, so total offers are usually higher than total graduates.
| University Name | 23-25 avg Matriculations23-25 avg Matric. | 23-25 avg Matric. %23-25 avg % | 22-24 avg Matriculations22-24 avg Matric. | 22-24 avg Matric. %22-24 avg % | QS | US | THE |
|---|---|---|---|---|---|---|---|
Princeton University | 0.3 | 0.2% | 0.7 | 0.4% | 25 | 1 | 3 |
Harvard University | 1.0 | 0.6% | 1.0 | 0.6% | 5 | 3 | 5 |
Stanford University | 2.3 | 1.4% | 1.7 | 1.0% | 3 | 4 | 6 |
Yale University | 0.3 | 0.2% | 1.0 | 0.6% | 21 | 4 | 10 |
University of Chicago | 2.3 | 1.4% | 2.0 | 1.2% | 13 | 6 | 15 |
University of Pennsylvania | 2.0 | 1.2% | 1.3 | 0.8% | 15 | 7 | 14 |
Johns Hopkins University | 2.0 | 1.2% | 1.7 | 1.0% | 24 | 7 | 16 |
Northwestern University | 2.0 | 1.2% | 1.7 | 1.0% | 42 | 7 | 30 |
Duke University | 1.7 | 1.0% | 1.3 | 0.8% | 62 | 7 | 28 |
California Institute of Technology | - | - | 0.3 | 0.2% | 10 | 11 | 7 |
Cornell University | 3.0 | 1.8% | 2.0 | 1.2% | 16 | 12 | 18 |
Brown University | 1.0 | 0.6% | 1.0 | 0.6% | 69 | 13 | 65 |
Dartmouth College | 0.7 | 0.4% | 0.7 | 0.4% | 247 | 13 | 180 |
University of California, Berkeley | 5.0 | 3.1% | 5.3 | 3.3% | 17 | 15 | 9 |
Columbia University | 3.0 | 1.8% | 3.0 | 1.9% | 38 | 15 | 20 |
University of California, Los Angeles | 3.0 | 1.8% | 3.3 | 2.1% | 46 | 17 | 19 |
Rice University | 1.0 | 0.6% | 0.7 | 0.4% | 119 | 17 | 103 |
Vanderbilt University | 1.0 | 0.6% | 0.3 | 0.2% | 250 | 17 | 92 |
University of Michigan-Ann Arbor | 3.3 | 2.0% | 2.0 | 1.2% | 45 | 20 | 23 |
Carnegie Mellon University | 2.0 | 1.2% | 2.0 | 1.2% | 52 | 20 | 24 |
| University Name | 23-25 avg Matriculations23-25 avg Matric. | 23-25 avg Matric. %23-25 avg % | 22-24 avg Matriculations22-24 avg Matric. | 22-24 avg Matric. %22-24 avg % | QS | US | THE |
|---|---|---|---|---|---|---|---|
Imperial College London | 0.3 | 0.2% | 1.0 | 0.6% | 2 | - | 8 |
University of Oxford | 0.3 | 0.2% | 1.0 | 0.6% | 4 | - | 1 |
University of Cambridge | 1.0 | 0.6% | 0.7 | 0.4% | 6 | - | 4 |
University College London | 4.3 | 2.7% | 4.3 | 2.7% | 9 | - | - |
King's College London | 1.0 | 0.6% | 1.0 | 0.6% | 31 | - | - |
University of Edinburgh | 0.7 | 0.4% | 1.0 | 0.6% | 34 | - | 29 |
University of Glasgow | 0.3 | 0.2% | 0.3 | 0.2% | 79 | - | 84 |
Durham University | 1.0 | 0.6% | 1.7 | 1.0% | 94 | - | 175 |
Queen Mary University of London | - | - | 0.3 | 0.2% | - | - | 134 |
University of Bath | 0.3 | 0.2% | - | - | - | - | - |
Cardiff University | 0.3 | 0.2% | - | - | - | - | - |
University of Reading | - | - | 0.3 | 0.2% | - | - | - |
Oxford Brookes University | - | - | 0.3 | 0.2% | - | - | - |
Kingston University | 0.3 | 0.2% | - | - | - | - | - |
University of the Arts London | - | - | 0.3 | 0.2% | - | - | - |
| University Name | 23-25 avg Matriculations23-25 avg Matric. | 23-25 avg Matric. %23-25 avg % | 22-24 avg Matriculations22-24 avg Matric. | 22-24 avg Matric. %22-24 avg % | QS | US | THE |
|---|---|---|---|---|---|---|---|
The University of Hong Kong | 1.0 | 0.6% | 1.3 | 0.8% | 11 | - | - |
The Chinese University of Hong Kong | 0.3 | 0.2% | - | - | 32 | - | 43 |
The Hong Kong University of Science and Technology | 2.0 | 1.2% | 1.7 | 1.0% | 44 | - | 60 |
The Hong Kong Polytechnic University | 0.3 | 0.2% | 0.3 | 0.2% | 54 | - | 80 |
| University Name | 23-25 avg Matriculations23-25 avg Matric. | 23-25 avg Matric. %23-25 avg % | 22-24 avg Matriculations22-24 avg Matric. | 22-24 avg Matric. %22-24 avg % | QS | US | THE | Country |
|---|---|---|---|---|---|---|---|---|
Trinity College Dublin | 0.7 | 0.4% | 0.3 | 0.2% | 75 | - | 173 | 爱尔兰 |
Bocconi University | - | - | 0.3 | 0.2% | - | - | - | 意大利 |
IE University | 1.0 | 0.6% | 0.3 | 0.2% | - | - | - | 西班牙 |
Les Roches International School of Hotel Management | 0.3 | 0.2% | - | - | - | - | - | 瑞士 |
Erasmus University Rotterdam | 0.3 | 0.2% | 0.3 | 0.2% | - | - | 107 | 荷兰 |
University of Maastricht | 0.3 | 0.2% | - | - | - | - | 131 | 荷兰 |
EDHEC Business School | - | - | 0.3 | 0.2% | - | - | - | 法国 |
| University Name | 23-25 avg Matriculations23-25 avg Matric. | 23-25 avg Matric. %23-25 avg % | 22-24 avg Matriculations22-24 avg Matric. | 22-24 avg Matric. %22-24 avg % | QS | US | THE |
|---|---|---|---|---|---|---|---|
McGill University | 1.3 | 0.8% | 1.0 | 0.6% | 27 | - | 42 |
University of Toronto | 6.0 | 3.7% | 4.7 | 2.9% | 29 | - | 21 |
University of British Columbia | 4.0 | 2.4% | 3.7 | 2.3% | 40 | - | 45 |
University of Waterloo | 0.3 | 0.2% | - | - | - | - | 162 |
Western University | - | - | 0.3 | 0.2% | - | - | - |
University of Ottawa | - | - | 0.3 | 0.2% | - | - | 187 |
University of Victoria | 0.7 | 0.4% | 0.3 | 0.2% | - | - | - |
Concordia University | - | - | 0.3 | 0.2% | - | - | - |
University of Lethbridge | - | - | 0.3 | 0.2% | - | - | - |
Toronto Metropolitan University | 0.3 | 0.2% | 0.3 | 0.2% | - | - | - |
| University Name | 23-25 avg Matriculations23-25 avg Matric. | 23-25 avg Matric. %23-25 avg % | 22-24 avg Matriculations22-24 avg Matric. | 22-24 avg Matric. %22-24 avg % | QS | US | THE |
|---|---|---|---|---|---|---|---|
The University of Melbourne | 0.3 | 0.2% | 0.3 | 0.2% | 19 | - | - |
The University of Sydney | 0.7 | 0.4% | 0.3 | 0.2% | 25 | - | 54 |
Queenstown Resort College | 0.3 | 0.2% | - | - | - | - | - |
The Australian National University | 0.3 | 0.2% | - | - | - | - | - |
University of New South Wales | 0.3 | 0.2% | 0.3 | 0.2% | - | - | - |
| University Name | 23-25 avg Matriculations23-25 avg Matric. | 23-25 avg Matric. %23-25 avg % | 22-24 avg Matriculations22-24 avg Matric. | 22-24 avg Matric. %22-24 avg % | QS | US | THE | Country |
|---|---|---|---|---|---|---|---|---|
Seoul National University | 0.3 | 0.2% | - | - | 38 | - | 59 | 韩国 |
Waseda University | 0.3 | 0.2% | 0.7 | 0.4% | - | - | - | 日本 |
Keio University | 0.3 | 0.2% | 0.3 | 0.2% | - | - | - | 日本 |
Ritsumeikan University | 0.3 | 0.2% | 0.3 | 0.2% | - | - | - | 日本 |
Sources
Apply
Sources
Activities
香港国际学校提供全港最丰富的课外活动,尤以体育见长,形成了以运动学院和俱乐部为核心的多元体系。
特色与亮点
- 体育规模全港领先:设有水上运动、足球、篮球三大运动学院,约60%的中学生积极参与体育类课外活动。
- 小众运动资源丰富:除常规球类外,提供击剑、攀岩、蹦床、棒球、长曲棍球及橄榄球等由专业机构组织的特色项目。
- 艺术与STEM并重:涵盖迪士尼音乐剧、多类舞蹈及管弦乐;STEM领域包含基础编程、无人机代码及机器人等前沿课程。
- 竞技实力表现卓越:学校在游泳、足球和篮球项目中具备极高竞技水平,常年在全港各类体育赛事中获得佳绩。
- 夏校课程极具人气:每年三月下旬开启为期三周的夏令营报名,因课程针对性强且名额有限,通常需在首日完成抢报。
选拔与验证建议
建议家长重点关注学校的三大运动学院以获取专业训练资源,并务必在三月首日关注夏校报名系统以确保名额。
Meal|Bus|Uniform
Meal Service
- Vendor: Sodexo China
- Lunch Price: HK$65
- Quality Score: 5/5
- Phone: /
- Email: /
School Bus Service
- Vendor: Kwoon Chung Bus
- Service Area: Coverage is mainly on Hong Kong Island; in Kowloon, the farthest coverage reaches only Kowloon Tong.
- Phone: (852)2979 8798
- Email: hkis@kcm.com.hk
- Routes & Fees
Uniform Service
- Vendor: HKIS Dragon Shop
- Price: Uniform prices: T-shirt HK$140, shorts HK$170, jacket HK$275-HK$300.
- Phone: /
- Email: /
- Purchase Platform
Living
香港国际学校通勤便利度受地理位置影响显著,浅水湾与大潭片区优势最大,新界地区最为不便。
居住通勤要点分析
- 香港国际学校小学部靠近浅水湾,中学部靠近大潭红山半岛,两片区学生可步行上学,通勤压力最小。
- 黄竹坑与鸭脷洲片区属于校车覆盖的较近区域,通勤时间相对较短,是除步行区外的优质选择。
- 铜锣湾、跑马地及薄扶林等港岛片区通勤时间在可接受范围内;港岛北区如湾仔、东区等时间相对较长。
- 九龙片区虽有校车覆盖,但通勤时间较长,可能对学生每日作息及课外活动参与造成一定影响。
- 新界地区目前无校车服务,家长需自行接送,通勤成本与难度极高,属于居住劣势区域。
- 信息补充:报告未提供具体校车路线图、各片区详细通勤分钟数及周边公共交通配套设施等量化数据。
执行建议
建议家长根据申请年级(小学或中学)精准选址,并针对九龙或港岛北区提前进行早高峰通勤实地验证。
Strengths
- Repulse Bay and Redhill Peninsula (Tai Tam) are the nearest areas to the school; students in these areas can walk to the primary and secondary campuses respectively.
- Wong Chuk Hang and Ap Lei Chau are relatively nearby areas served by the school bus.
Neutral
- Other Hong Kong Island areas, such as Causeway Bay, Happy Valley, and Pok Fu Lam, have commuting times within an acceptable range to the school.
- Northern Hong Kong Island areas, including Wan Chai, Eastern District, and Central and Western District, have relatively longer commute times.
Weaknesses
- Although school buses serve Kowloon areas, commute times are relatively long.
- There is no school bus service to the New Territories, so self drop-off and pick-up are required, which is quite inconvenient.
Living & Commute Recommendations
| # | Estate | Best Commute | Commute Time | Distance | Overall Score |
|---|---|---|---|---|---|
| Loading... | |||||
Note: Monthly rent/total price are estimates based on government RVD monthly residential averages by area and size, for school-living decisions only.