
CANADIAN INTERNATIONAL SCHOOL OF HONG KONG
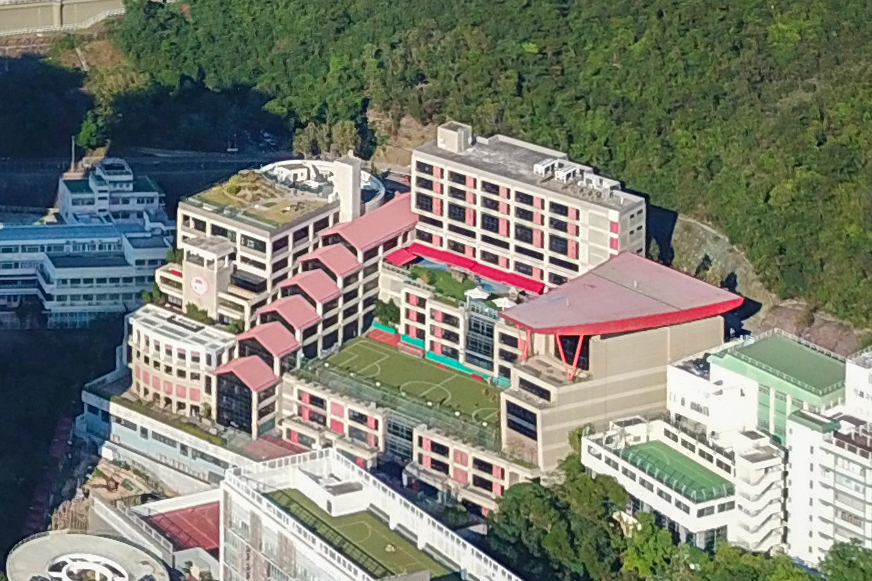
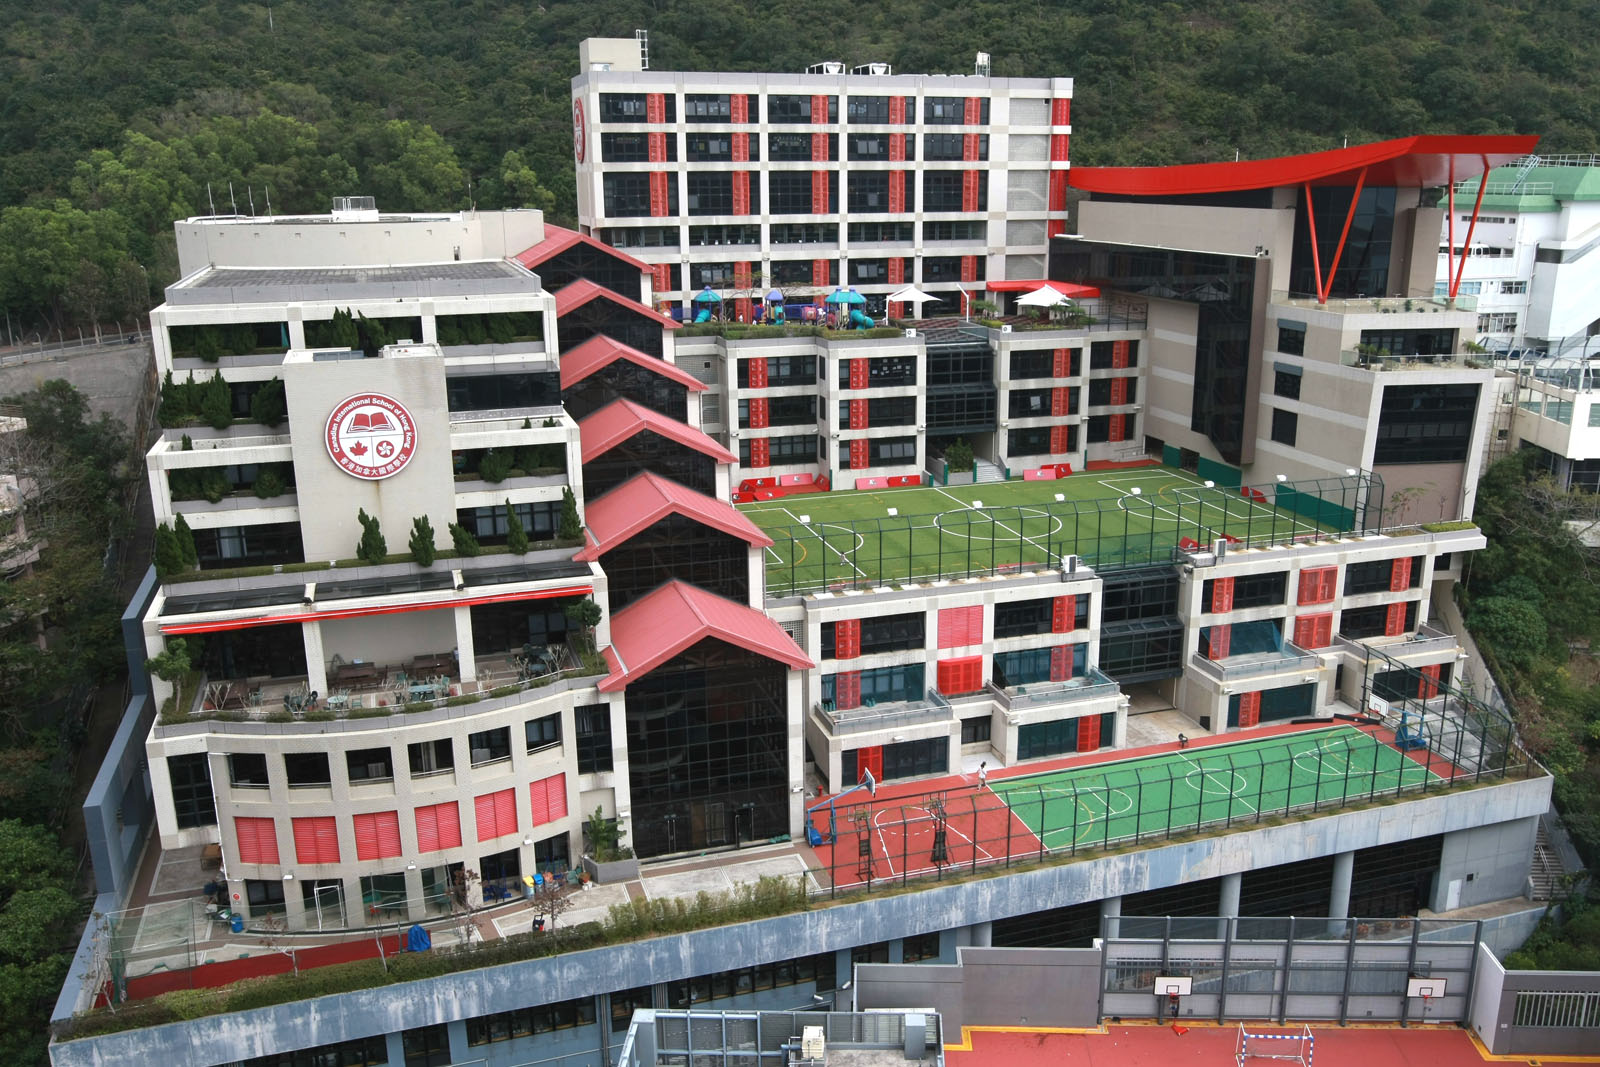
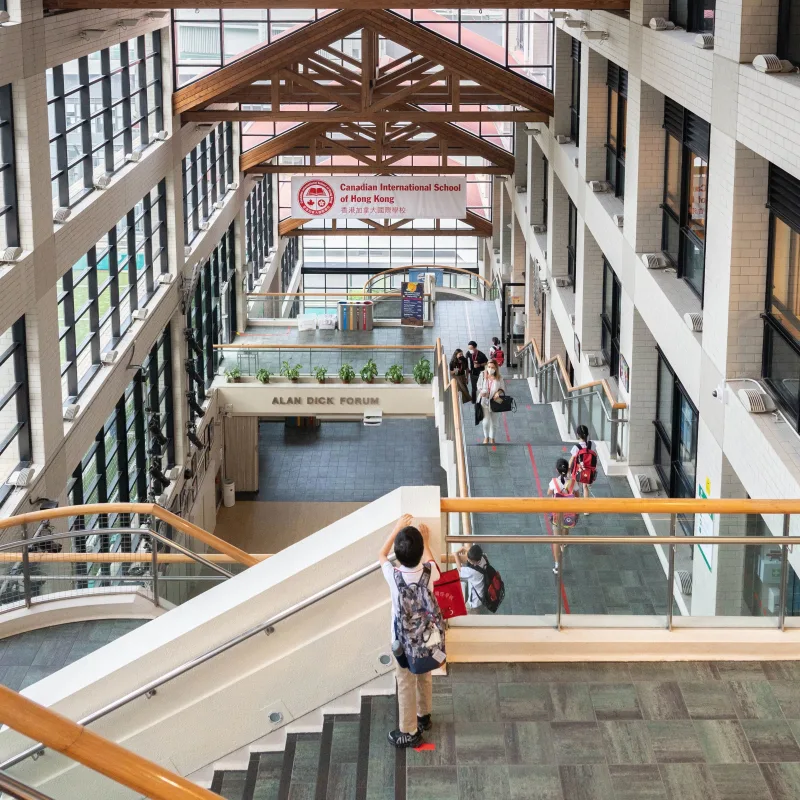
CANADIAN INTERNATIONAL SCHOOL OF HONG KONG
- CDNIS
加拿大国际学校是香港唯一的IBDP和OSSD双文凭的国际学校,2024年开始转变为双语学校,增加了中文的课程比例,因此非常受华人家庭的欢迎。
全港IB国际学校中按升学成绩排名第7
Overview
Curriculum Type
School Type
International
Through-train
Through-train
Curriculum Features
IBPYP→IBMYP→IBDP&OSSD
Classes & Students
Age Group
08.31
Grade Setup
PN ~ G12
Classes Count
5 - 8
Students / Class
14 - 26
Total Students
1,700 - 1,800
Teaching Language
Teaching Language
English / Chinese
Chinese Characters
Traditional Chinese
Chinese Session
每周一半Session
Religion
Religion
No Religion
Founded
1991
School Hours
7:30 am - 5:00 pm
费用情况
Annual Tuition
HK$156,300 - $254,300
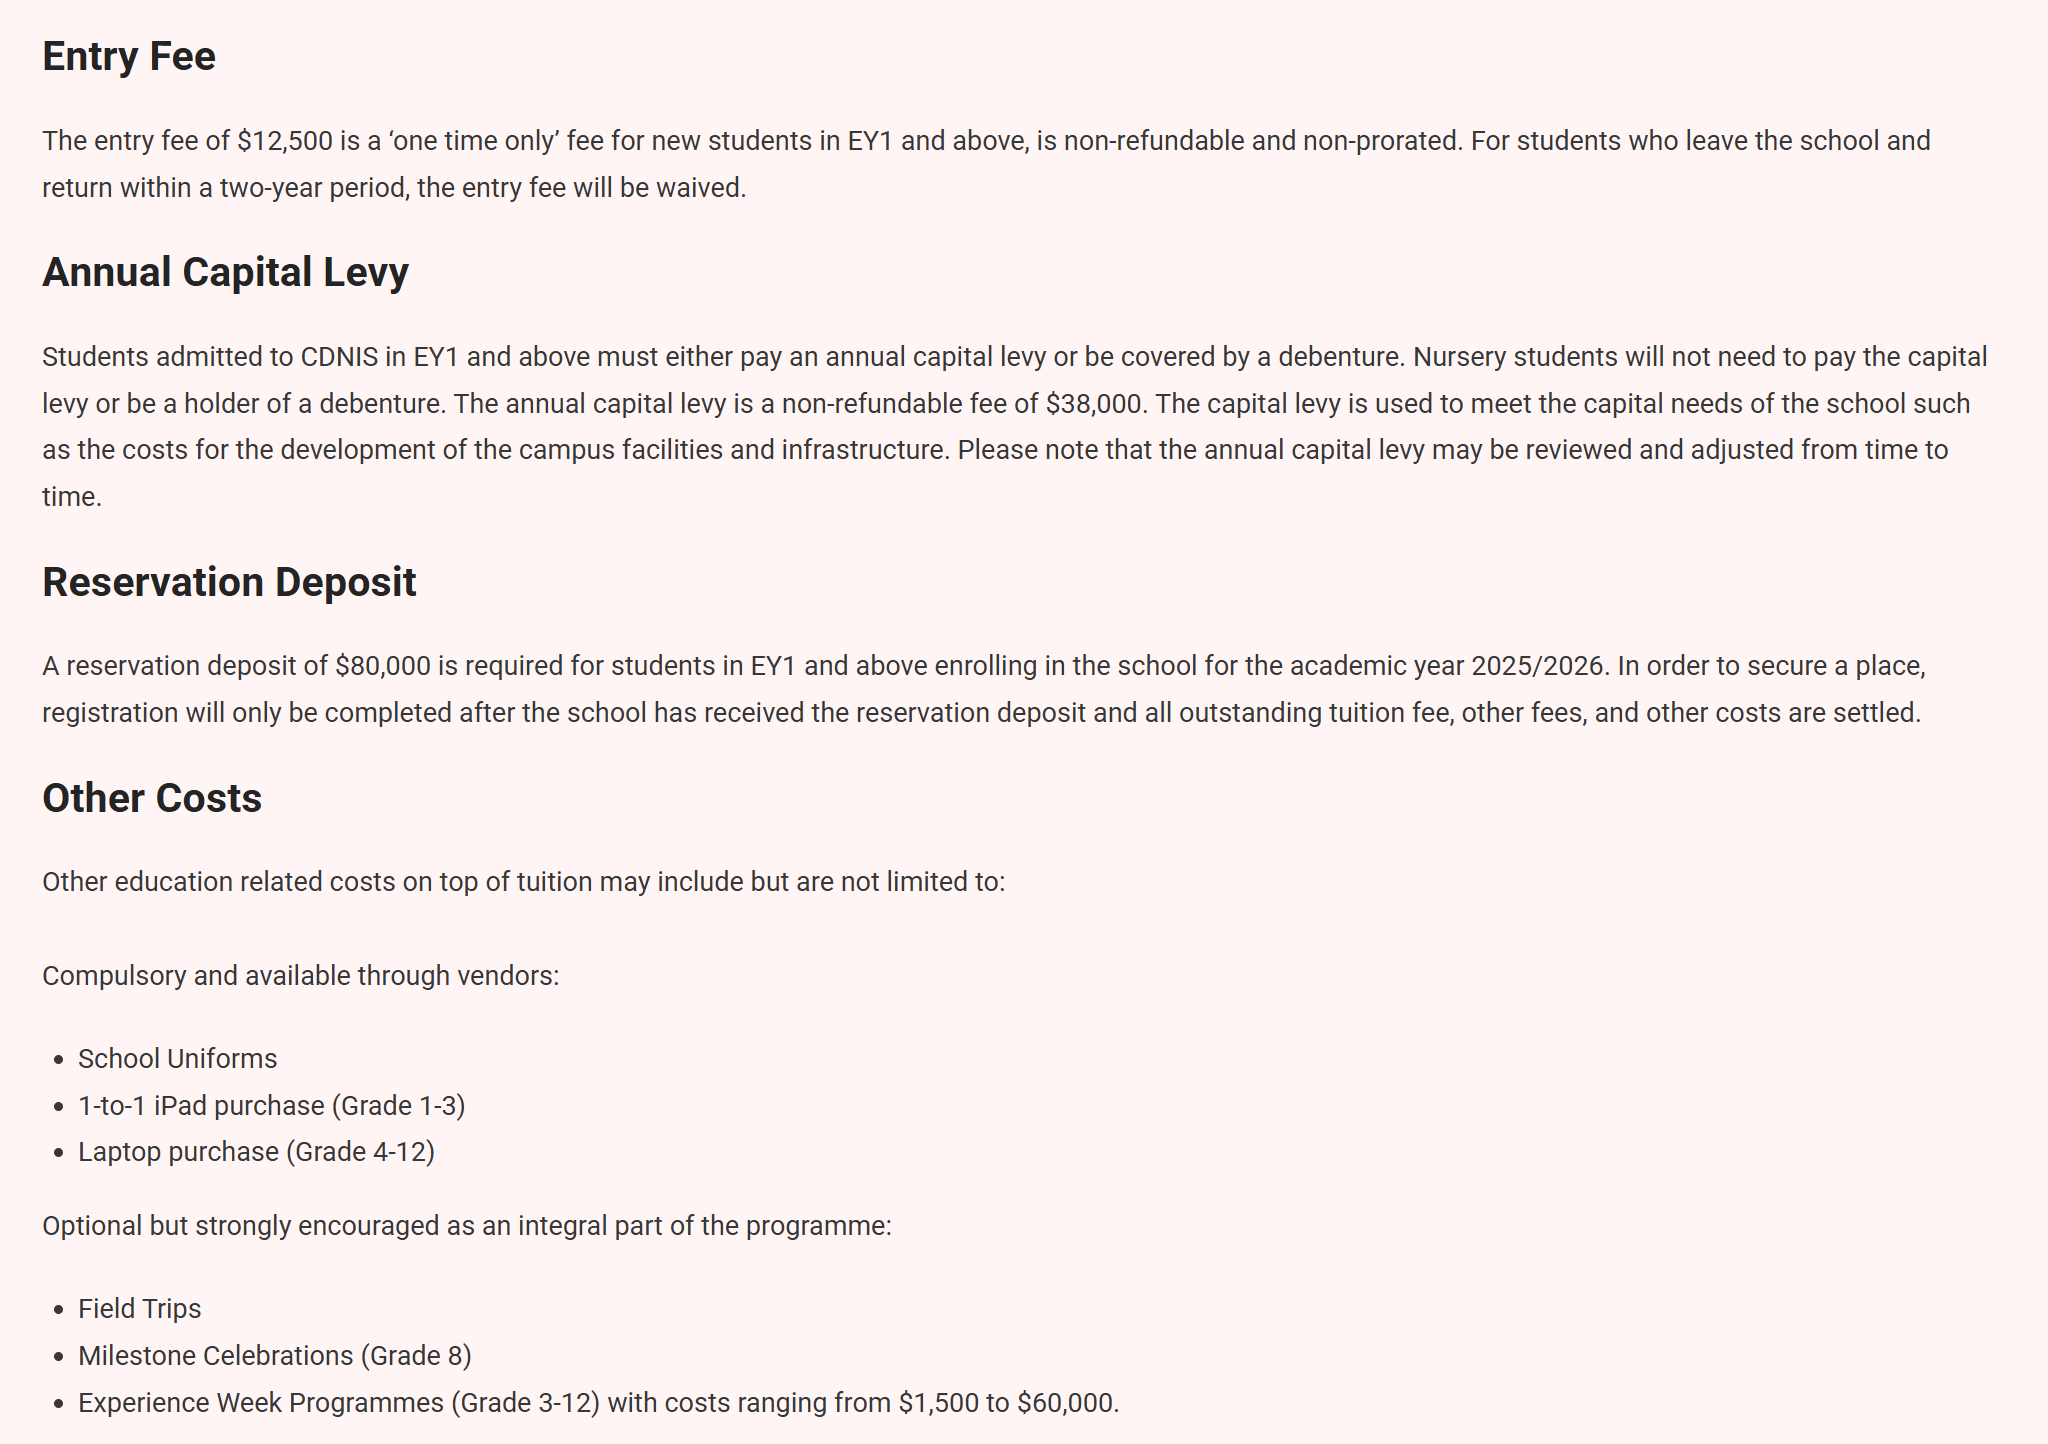
Capital Levy
HK$38,000
Debenture
正常 Enrollment No debenture,提供可优先 Enrollment 的 Debenture,必须通过 Profile 购买,具体 Price Profile 确定,每 Year 不同。
Other
Boarding Service
不提供寄宿
Priority Eligibility
资本 Debenture 计划的提名人或潜在 Debenture 持 Yes 者、在 CDNIS 就读的 Students 的兄弟姐妹、持 Yes Canada 国籍或护照的 Application 者、校友和教职员工的子 Girls 通过 Admission Assessment 并被列入前一学 Year 等待名单的 Application 者
Entrance Exam
MAP / English Writing / English Interview
Application Info
Minimum Application Grade
P1
Maximum Application Grade
G11
Eligible Application Grades
PN / K1 / K2 / K3 / G1 / G2 / G3 / G4 / G5 / G6 / G7 / G8 / G9 / G10 / G11 / G12
Application Method
Online Application
Transfer Application Opens
PN 为 Nov1 日 Start Application,Other Grade 为 Application Enrollment 时间的前一 Year
Transfer Application Deadline
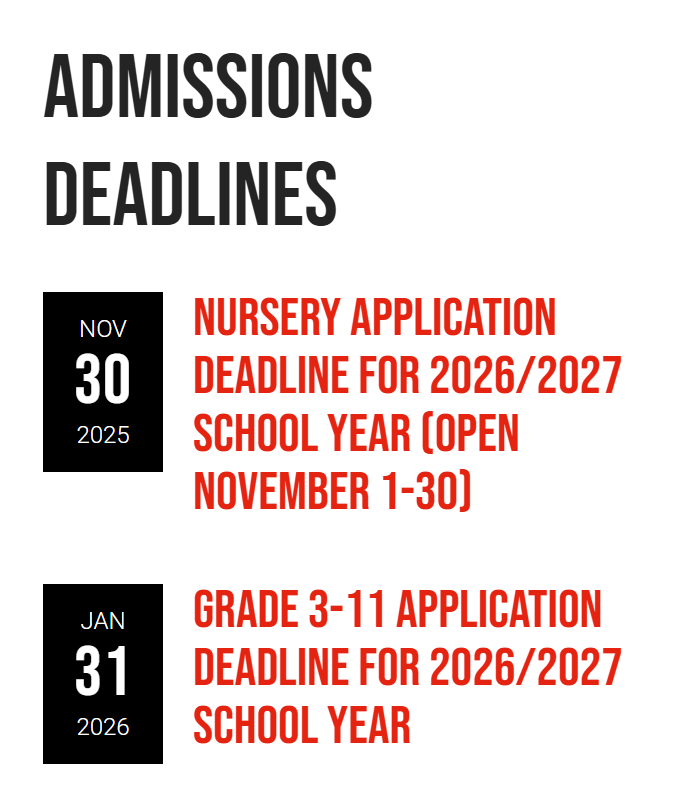
PN为Nov30日,EY1 - G2为Oct2日Deadline,G3以上Grade为Jan31日
School Documents
Useful Links
Contact
Phone
招生:(852) 2525 7088 / 招生:(852) 2240 6363
Email
admissions@cdnis.edu.hk / 招生:admissions@cdnis.edu.hk / 咨询:schoolinfo@cdnis.edu.hk
Address
Hong Kong Hong Kong 仔南朗山道 36 号
Map Location
Canadian International School Hong Kong
Relation
Relationship Notes
不保证直升,但 Application 本部的 EY1Yes 优先权。目前还 No 第一批升读 Canada International EY1 的 Students
Fees
School Fees Ranking
Rank 18 / 98
Higher Ranked
Lower Ranked
2025-2026 Fee Information
| Grade | School Level | Age | Fees | Capital Levy | Annual Expenditure | Stage |
|---|---|---|---|---|---|---|
| PN | Nursery | 2 | $138,600 | - | $138,600 | Kindergarten |
| K1 | EY1 | 3 | $156,300 | $38,000 | $194,300 | Kindergarten |
| K2 | EY2 | 4 | $203,100 | $38,000 | $241,100 | Kindergarten |
| K3 | Preparatory | 5 | $210,900 | $38,000 | $248,900 | Kindergarten |
| G1 | G1 | 6 | $210,900 | $38,000 | $248,900 | Primary |
| G2 | G2 | 7 | $210,900 | $38,000 | $248,900 | Primary |
| G3 | G3 | 8 | $191,800 | $38,000 | $229,800 | Primary |
| G4 | G4 | 9 | $193,600 | $38,000 | $231,600 | Primary |
| G5 | G5 | 10 | $193,600 | $38,000 | $231,600 | Primary |
| G6 | G6 | 11 | $212,800 | $38,000 | $250,800 | Lower Secondary MYP |
| G7 | G7 | 12 | $216,600 | $38,000 | $254,600 | Lower Secondary MYP |
| G8 | G8 | 13 | $216,600 | $38,000 | $254,600 | Lower Secondary MYP |
| G9 | G9 | 14 | $237,700 | $38,000 | $275,700 | Upper Secondary MYP |
| G10 | G10 | 15 | $237,700 | $38,000 | $275,700 | Upper Secondary MYP |
| G11 | G11 | 16 | $254,300 | $38,000 | $292,300 | Upper Secondary IBDP |
| G12 | G12 | 17 | $254,300 | $38,000 | $292,300 | Upper Secondary IBDP |
Data Notes
Note: Capital levy in the table is payable annually. Annual expenditure = annual tuition + annual capital levy.
Kindergarten PN$138,600
半天班, PN Class
Kindergarten K1$156,300
半天班, 幼儿班
Kindergarten K2$203,100
全天班, EY2
Kindergarten K3$210,900
全天班, Preparatory
Primary G1 - G2$210,900
IBPYP
Primary G3$191,800
IBPYP
Primary G4 - G5$193,600
IBPYP
Secondary G6$212,800
IBPYP
Secondary G7 - G8$216,600
IBPYP
Secondary G9 - G10$237,700
IBMYP
Secondary G11 - G12$254,300
IBDP
Other Fees
Capital LevyHK$38,000
Debenture (Mandatory Purchase)-
No debenture
Refundable Debenture-
None需购买可退还的Debenture
Non-refundable Debenture/
No non-refundable debenture
Nomination Right DebentureHK$1,800,000+
该 Debenture Price 不固定,Profile 每 Year 重新定价,该 Price 近 Year 逐 Year 递增
Enrollment FeeHK$12,500
Enrollment均需要支付该笔Sign up费,不可退还
Sources

×
1 / 1
Exam
IB Ranking
Rank 13 / 36
Higher Ranked
Lower Ranked
IB Overview
| Metrics | 2025 | 2024 | 2023 | Change |
|---|---|---|---|---|
| Key Metrics | ||||
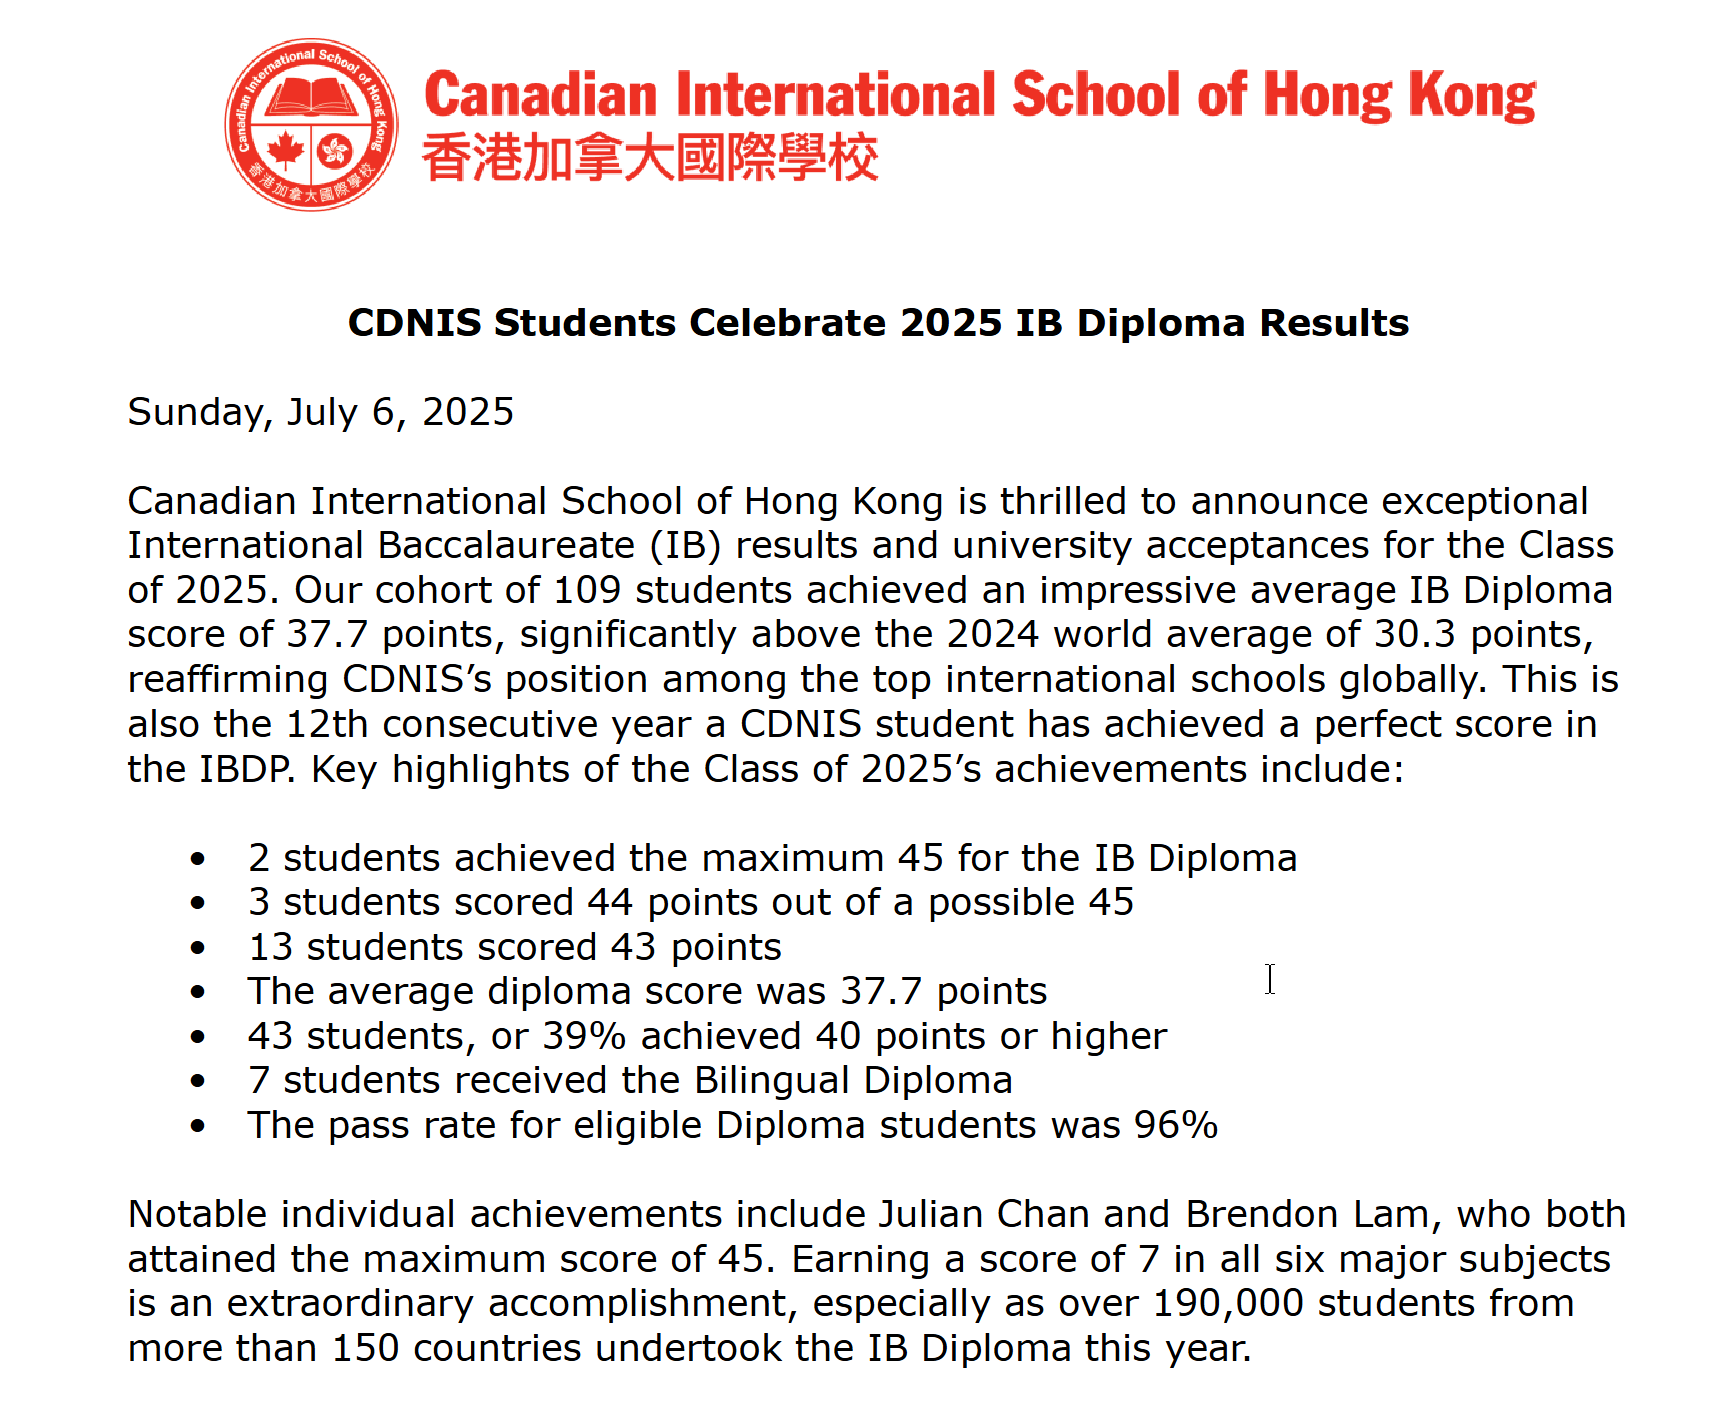
| Average Ranking Score | 38.0 | 38.0 | 37.0 | - |
| 合格人数 (合格率) | 105 | 96.0% | 103 | 99.0% | 100 | 100.0% | ▲ 2.0 |
| 双语文凭人数 (双语文凭率) | 7 | 6.4% | 10 | 9.6% | 10 | 10.0% | ▼ 3.0 |
| 人数指标 | ||||
| IB Candidates (IB人数比例) | 109 | 100.0% | 104 | 95.4% | 100 | 100.0% | ▲ 5.0 |
| 非 IB Candidates (非IB人数比例) | - | 5 | 4.6% | - | - |
| Total Students | 109 | 109 | 100 | - |
| 高分段人数分布 | ||||
| IB 45分人数 (IB45分%) | 2 | 1.8% | 2 | 1.9% | 4 | 4.0% | - |
| IB 44分人数 (IB44分%) | 3 | 2.8% | 2 | 1.9% | 2 | 2.0% | ▲ 1.0 |
| IB 43分人数 (IB43分%) | 13 | 11.9% | 9 | 8.7% | 7 | 7.0% | ▲ 4.0 |
| 各分数段Cumulative人数 | ||||
| IB 43+人数 (IB43+%) | 18 | 16.6% | 13 | 12.5% | 13 | 13.0% | ▲ 5.0 |
| IB 40+人数 (IB40+%) | 43 | 39.4% | 43 | 41.3% | 26 | 26.0% | - |
| IB 30+人数 (IB30+%) | - | 102 | 98.0% | - | - |
Sources
×
1 / 1
Placement
University Placement Ranking
Rank 10 / 31
Higher Ranked
Lower Ranked
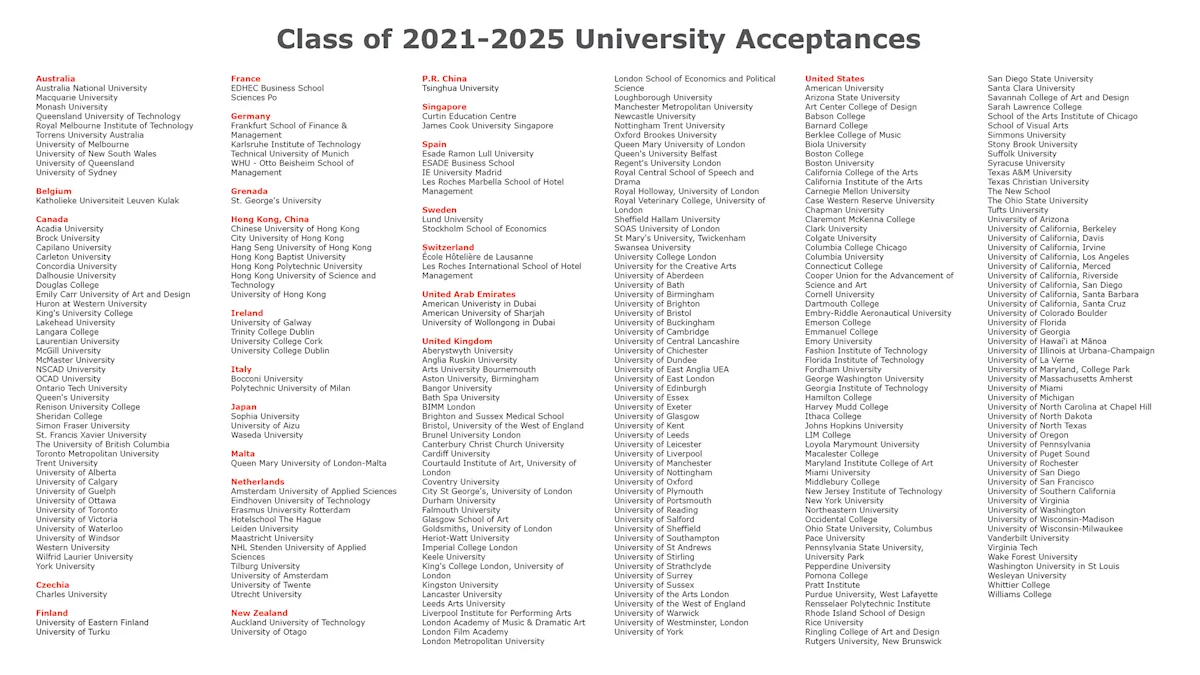
2025 Study-abroad Country Analysis
21-25Enrollment
21-24Enrollment
| Country/Region | 21-25Enrollment | Share | 21-24Enrollment | Share | Change |
|---|---|---|---|---|---|
| United States | 108 | 21.4% | 88 | 22.5% | ↓ 1.1% |
| United Kingdom | 144 | 28.6% | 102 | 26.1% | ↑ 2.5% |
| Hong Kong | 75 | 14.9% | 52 | 13.3% | ↑ 1.6% |
| Canada | 140 | 27.8% | 117 | 29.9% | ↓ 2.1% |
| Australia | 17 | 3.4% | 15 | 3.8% | ↓ 0.5% |
| Europe | 16 | 3.2% | 14 | 3.6% | ↓ 0.4% |
| Asia | 3 | 0.6% | 3 | 0.8% | ↓ 0.2% |
| Other | 1 | 0.2% | - | - | ↑ 0.2% |
| Total | 504 | 100.0% | 391 | 100.0% | - |
2025 University Tier Analysis
| University Tier | 21-25Annual AverageEnrollment25Enrollment | 21-25Annual AverageEnrollment%25% | 21-25Annual AverageEnrollmentCumulative%25Cumulative | 21-24Annual AverageEnrollment24Enrollment | 21-24Annual AverageEnrollment%24% | 21-24Annual AverageEnrollmentCumulative%24Cumulative | ΔOffers%Δ% |
|---|---|---|---|---|---|---|---|
| Total Students | 100 | 100.0% | - | 98 | 100.0% | - | - |
| Ivy League | 1 | 1.4% | - | 1 | 1.0% | - | +0.4% |
| US Top 10 | 1 | 0.6% | 0.6% | 1 | 0.5% | 0.5% | +0.1% |
| US Top 20 | 6 | 6.2% | 6.8% | 6 | 6.4% | 6.9% | -0.2% |
| UK Oxbridge | 1 | 1.0% | 7.8% | 1 | 1.0% | 7.9% | 0.0% |
| US Top 30 | 3 | 3.0% | 10.8% | 3 | 3.1% | 11.0% | -0.1% |
| UK G5 | 8 | 8.2% | 19.0% | 7 | 7.2% | 18.2% | +1.0% |
| HK Top 3 | 15 | 14.6% | 33.5% | 13 | 12.8% | 30.9% | +1.8% |
| Liberal Arts Top 10 | 1 | 1.0% | 34.5% | 2 | 1.8% | 32.7% | -0.8% |
| US Top 50 | 6 | 6.4% | 40.9% | 7 | 6.6% | 39.4% | -0.3% |
| Singapore Top 2 | 0 | 0.2% | 41.1% | 0 | 0.3% | 39.6% | -0.1% |
| Europe Top 5 | 0 | 0.2% | 41.3% | 0 | 0.3% | 39.9% | -0.1% |
| Canada Top 3 | 20 | 19.8% | 61.1% | 21 | 21.2% | 61.1% | -1.5% |
| Asia Top | 0 | 0.2% | 61.3% | 0 | 0.3% | 61.4% | -0.1% |
| Liberal Arts Top 20 | 0 | 0.4% | 61.7% | 0 | 0.3% | 61.6% | +0.1% |
| UK Top 10 | 7 | 6.8% | 68.5% | 7 | 6.9% | 68.5% | -0.1% |
| Europe Top 10 | 0 | 0.2% | 68.7% | - | - | 68.5% | +0.2% |
| HK Top 5 | 0 | 0.2% | 68.9% | 0 | 0.3% | 68.8% | -0.1% |
| QS Top 100 | 4 | 3.6% | 72.5% | 3 | 3.3% | 72.1% | +0.3% |
| US Top 100 | 1 | 1.0% | 73.5% | 1 | 1.3% | 73.4% | -0.3% |
| US Top 100+ | 2 | 2.0% | 75.4% | 2 | 1.5% | 74.9% | +0.5% |
2024-2025 Detailed University Placement Results
| University Name | 21-25 avg Matriculations21-25 avg Matric. | 21-25 avg Matric. %21-25 avg % | 21-24 avg Matriculations21-24 avg Matric. | 21-24 avg Matric. %21-24 avg % | QS | US | THE | Country |
|---|---|---|---|---|---|---|---|---|
University of Pennsylvania | 0.2 | 0.2% | - | - | 15 | 7 | 14 | United States |
Cornell University | 0.8 | 0.8% | 0.5 | 0.5% | 16 | 12 | 18 | United States |
University of California, Berkeley | 2.8 | 2.8% | 2.8 | 2.8% | 17 | 15 | 9 | United States |
Johns Hopkins University | 0.4 | 0.4% | 0.5 | 0.5% | 24 | 7 | 16 | United States |
Columbia University | 0.2 | 0.2% | 0.3 | 0.3% | 38 | 15 | 20 | United States |
University of California, Los Angeles | 1.2 | 1.2% | 1.5 | 1.5% | 46 | 17 | 19 | United States |
Carnegie Mellon University | 0.4 | 0.4% | 0.5 | 0.5% | 52 | 20 | 24 | United States |
New York University | 3.0 | 3.0% | 3.0 | 3.1% | 55 | 32 | 32 | United States |
University of California, San Diego | 0.8 | 0.8% | 0.8 | 0.8% | 66 | 29 | 47 | United States |
University of Wisconsin-Madison | 0.6 | 0.6% | 0.8 | 0.8% | 110 | 36 | 55 | United States |
Rice University | 0.2 | 0.2% | 0.3 | 0.3% | 119 | 17 | 103 | United States |
Georgia Institute of Technology | 0.2 | 0.2% | 0.3 | 0.3% | 123 | 32 | 41 | United States |
University of Southern California | 1.6 | 1.6% | 1.8 | 1.8% | 146 | 28 | 73 | United States |
Washington University in St. Louis | 0.2 | 0.2% | - | - | 167 | 20 | 67 | United States |
Emory University | 0.4 | 0.4% | 0.5 | 0.5% | 182 | 24 | 102 | United States |
University of Florida | 0.2 | 0.2% | - | - | 212 | 30 | 134 | United States |
Dartmouth College | 0.2 | 0.2% | 0.3 | 0.3% | 247 | 13 | 180 | United States |
Vanderbilt University | 0.2 | 0.2% | 0.3 | 0.3% | 250 | 17 | 92 | United States |
Tufts University | 0.4 | 0.4% | 0.3 | 0.3% | 334 | 36 | 189 | United States |
Boston College | 0.2 | 0.2% | 0.3 | 0.3% | 526 | 36 | - | United States |
Data Notes
Matriculation counts students who finally enroll at a university. Since each student enrolls in only one university, total matriculations usually do not exceed total graduates.
Offer counts admission offers received by students. A student may receive multiple offers, so total offers are usually higher than total graduates.
| University Name | 21-25 avg Matriculations21-25 avg Matric. | 21-25 avg Matric. %21-25 avg % | 21-24 avg Matriculations21-24 avg Matric. | 21-24 avg Matric. %21-24 avg % | QS | US | THE |
|---|---|---|---|---|---|---|---|
Johns Hopkins University | 0.4 | 0.4% | 0.5 | 0.5% | 24 | 7 | 16 |
University of Pennsylvania | 0.2 | 0.2% | - | - | 15 | 7 | 14 |
Cornell University | 0.8 | 0.8% | 0.5 | 0.5% | 16 | 12 | 18 |
Dartmouth College | 0.2 | 0.2% | 0.3 | 0.3% | 247 | 13 | 180 |
Columbia University | 0.2 | 0.2% | 0.3 | 0.3% | 38 | 15 | 20 |
University of California, Berkeley | 2.8 | 2.8% | 2.8 | 2.8% | 17 | 15 | 9 |
University of California, Los Angeles | 1.2 | 1.2% | 1.5 | 1.5% | 46 | 17 | 19 |
Rice University | 0.2 | 0.2% | 0.3 | 0.3% | 119 | 17 | 103 |
Vanderbilt University | 0.2 | 0.2% | 0.3 | 0.3% | 250 | 17 | 92 |
Carnegie Mellon University | 0.4 | 0.4% | 0.5 | 0.5% | 52 | 20 | 24 |
Washington University in St. Louis | 0.2 | 0.2% | - | - | 167 | 20 | 67 |
Emory University | 0.4 | 0.4% | 0.5 | 0.5% | 182 | 24 | 102 |
University of Southern California | 1.6 | 1.6% | 1.8 | 1.8% | 146 | 28 | 73 |
University of California, San Diego | 0.8 | 0.8% | 0.8 | 0.8% | 66 | 29 | 47 |
University of Florida | 0.2 | 0.2% | - | - | 212 | 30 | 134 |
New York University | 3.0 | 3.0% | 3.0 | 3.1% | 55 | 32 | 32 |
Georgia Institute of Technology | 0.2 | 0.2% | 0.3 | 0.3% | 123 | 32 | 41 |
Boston College | 0.2 | 0.2% | 0.3 | 0.3% | 526 | 36 | - |
Tufts University | 0.4 | 0.4% | 0.3 | 0.3% | 334 | 36 | 189 |
University of Wisconsin-Madison | 0.6 | 0.6% | 0.8 | 0.8% | 110 | 36 | 55 |
| University Name | 21-25 avg Matriculations21-25 avg Matric. | 21-25 avg Matric. %21-25 avg % | 21-24 avg Matriculations21-24 avg Matric. | 21-24 avg Matric. %21-24 avg % | QS | US | THE |
|---|---|---|---|---|---|---|---|
Imperial College London | 1.6 | 1.6% | 1.5 | 1.5% | 2 | - | 8 |
University of Oxford | 0.8 | 0.8% | 0.8 | 0.8% | 4 | - | 1 |
University of Cambridge | 0.2 | 0.2% | 0.3 | 0.3% | 6 | - | 4 |
University College London | 4.6 | 4.6% | 3.3 | 3.3% | 9 | - | - |
King's College London | 3.0 | 3.0% | 3.0 | 3.1% | 31 | - | - |
University of Edinburgh | 1.6 | 1.6% | 1.5 | 1.5% | 34 | - | 29 |
University of Bristol | 1.0 | 1.0% | 0.8 | 0.8% | 51 | - | 80 |
London School of Economics and Political Science | 2.0 | 2.0% | 2.3 | 2.3% | 56 | - | 52 |
University of Glasgow | 0.2 | 0.2% | 0.3 | 0.3% | 79 | - | 84 |
University of Leeds | 0.2 | 0.2% | - | - | 86 | - | 118 |
University of Southampton | 0.2 | 0.2% | 0.3 | 0.3% | 87 | - | 129 |
Durham University | 2.4 | 2.4% | 2.0 | 2.0% | 94 | - | 175 |
University of Manchester | 0.6 | 0.6% | 0.8 | 0.8% | - | - | 56 |
University of Sheffield | 0.4 | 0.4% | 0.5 | 0.5% | - | - | 108 |
University of Warwick | 0.6 | 0.6% | 0.8 | 0.8% | - | - | 122 |
University of Nottingham | 0.2 | 0.2% | 0.3 | 0.3% | - | - | 145 |
Queen Mary University of London | 0.2 | 0.2% | 0.3 | 0.3% | - | - | 134 |
University of York | 0.4 | 0.4% | 0.3 | 0.3% | - | - | 154 |
Newcastle University | 0.4 | 0.4% | - | - | - | - | 144 |
University of Liverpool | 0.2 | 0.2% | - | - | - | - | 143 |
| University Name | 21-25 avg Matriculations21-25 avg Matric. | 21-25 avg Matric. %21-25 avg % | 21-24 avg Matriculations21-24 avg Matric. | 21-24 avg Matric. %21-24 avg % | QS | US | THE |
|---|---|---|---|---|---|---|---|
The University of Hong Kong | 9.6 | 9.5% | 8.0 | 8.2% | 11 | - | - |
The Chinese University of Hong Kong | 3.0 | 3.0% | 2.3 | 2.3% | 32 | - | 43 |
The Hong Kong University of Science and Technology | 2.0 | 2.0% | 2.3 | 2.3% | 44 | - | 60 |
City University of Hong Kong | 0.2 | 0.2% | 0.3 | 0.3% | 63 | - | 73 |
Hong Kong Baptist University | 0.2 | 0.2% | 0.3 | 0.3% | - | - | - |
| University Name | 21-25 avg Matriculations21-25 avg Matric. | 21-25 avg Matric. %21-25 avg % | 21-24 avg Matriculations21-24 avg Matric. | 21-24 avg Matric. %21-24 avg % | QS | US | THE | Country |
|---|---|---|---|---|---|---|---|---|
Technical University of Munich | 0.2 | 0.2% | 0.3 | 0.3% | 22 | - | 27 | 德国 |
KU Leuven | 0.2 | 0.2% | - | - | 60 | - | 46 | 比利时 |
Lund University | 0.2 | 0.2% | 0.3 | 0.3% | 72 | - | 95 | 瑞典 |
Trinity College Dublin | 0.2 | 0.2% | 0.3 | 0.3% | 75 | - | 173 | 爱尔兰 |
Utrecht University | 0.2 | 0.2% | - | - | - | - | - | 荷兰 |
Leiden University | 0.4 | 0.4% | 0.5 | 0.5% | - | - | 71 | 荷兰 |
Tilburg University | 0.2 | 0.2% | 0.3 | 0.3% | - | - | - | 荷兰 |
Sciences Po | 0.2 | 0.2% | 0.3 | 0.3% | - | - | - | 法国 |
Bocconi University | 0.2 | 0.2% | 0.3 | 0.3% | - | - | - | 意大利 |
Ecole Hoteliere Lausanne | 0.2 | 0.2% | 0.3 | 0.3% | - | - | - | 瑞士 |
EDHEC Business School | 0.2 | 0.2% | 0.3 | 0.3% | - | - | - | 法国 |
Esade Ramon Llull University | 0.2 | 0.2% | 0.3 | 0.3% | - | - | - | 西班牙 |
Leiden University College The Hague | 0.2 | 0.2% | 0.3 | 0.3% | - | - | - | 荷兰 |
Les Roches International School of Hotel Management | 0.2 | 0.2% | 0.3 | 0.3% | - | - | - | 瑞士 |
Politecnico di Milano | 0.2 | 0.2% | 0.3 | 0.3% | - | - | - | 意大利 |
| University Name | 21-25 avg Matriculations21-25 avg Matric. | 21-25 avg Matric. %21-25 avg % | 21-24 avg Matriculations21-24 avg Matric. | 21-24 avg Matric. %21-24 avg % | QS | US | THE |
|---|---|---|---|---|---|---|---|
McGill University | 0.4 | 0.4% | 0.3 | 0.3% | 27 | - | 42 |
University of Toronto | 13.4 | 13.3% | 14.3 | 14.6% | 29 | - | 21 |
University of British Columbia | 6.0 | 6.0% | 6.3 | 6.4% | 40 | - | 45 |
University of Waterloo | 2.8 | 2.8% | 3.5 | 3.6% | - | - | 162 |
Western University | 1.2 | 1.2% | 1.0 | 1.0% | - | - | - |
McMaster University | 0.2 | 0.2% | - | - | - | - | 116 |
Queen's University | 0.6 | 0.6% | 0.3 | 0.3% | - | - | - |
Dalhousie University | 0.2 | 0.2% | 0.3 | 0.3% | - | - | - |
Simon Fraser University | 0.2 | 0.2% | 0.8 | 0.8% | - | - | - |
York University | 0.6 | 0.6% | 0.8 | 0.8% | - | - | - |
University of Victoria | 0.6 | 0.6% | 0.3 | 0.3% | - | - | - |
Emily Carr University of Art + Design | 0.2 | 0.2% | 0.3 | 0.3% | - | - | - |
Huron at Western University | 0.2 | 0.2% | 0.3 | 0.3% | - | - | - |
NSCAD University | 0.2 | 0.2% | 0.3 | 0.3% | - | - | - |
Sheridan College | 0.2 | 0.2% | - | - | - | - | - |
Toronto Metropolitan University | 0.8 | 0.8% | 0.8 | 0.8% | - | - | - |
Carleton University | 0.2 | 0.2% | 0.3 | 0.3% | - | - | - |
| University Name | 21-25 avg Matriculations21-25 avg Matric. | 21-25 avg Matric. %21-25 avg % | 21-24 avg Matriculations21-24 avg Matric. | 21-24 avg Matric. %21-24 avg % | QS | US | THE |
|---|---|---|---|---|---|---|---|
The University of Melbourne | 1.4 | 1.4% | 1.5 | 1.5% | 19 | - | - |
The University of Sydney | 0.4 | 0.4% | 0.3 | 0.3% | 25 | - | 54 |
Monash University | 0.4 | 0.4% | 0.5 | 0.5% | 36 | - | 58 |
University of Otago | 0.2 | 0.2% | 0.3 | 0.3% | - | - | - |
The Australian National University | 0.2 | 0.2% | 0.3 | 0.3% | - | - | - |
University of New South Wales | 0.8 | 0.8% | 1.0 | 1.0% | - | - | - |
| University Name | 21-25 avg Matriculations21-25 avg Matric. | 21-25 avg Matric. %21-25 avg % | 21-24 avg Matriculations21-24 avg Matric. | 21-24 avg Matric. %21-24 avg % | QS | US | THE | Country |
|---|---|---|---|---|---|---|---|---|
National University of Singapore | 0.2 | 0.2% | 0.3 | 0.3% | 8 | - | 17 | 新加坡 |
University of Aizu | 0.2 | 0.2% | 0.3 | 0.3% | - | - | - | 日本 |
Sources

21-24 Admission Results
×
1 / 1
Historical Offer Cases
以下为该校历 Year Offers 真实案例(已审核公开)。
N/A案例,欢迎成为第一位分享者。
Apply
Application Timeline
| General Grade | School Grade | Application Start | Application Deadline | Assessment Date | Admission Date |
|---|---|---|---|---|---|
| PN | Nursery | 2025/11/1 | 2025/11/30 | 2025/12 | 2026/1 |
| K1-G2 | EY1-G2 | 2024/10/3 | 2025/10/2 | 2025/11 | 2026/1 |
| G3-G11 | G3 - G11 | 2025/2/1 | 2026/1/31 | 2026/3 - 2026/4 | 2026/5 |
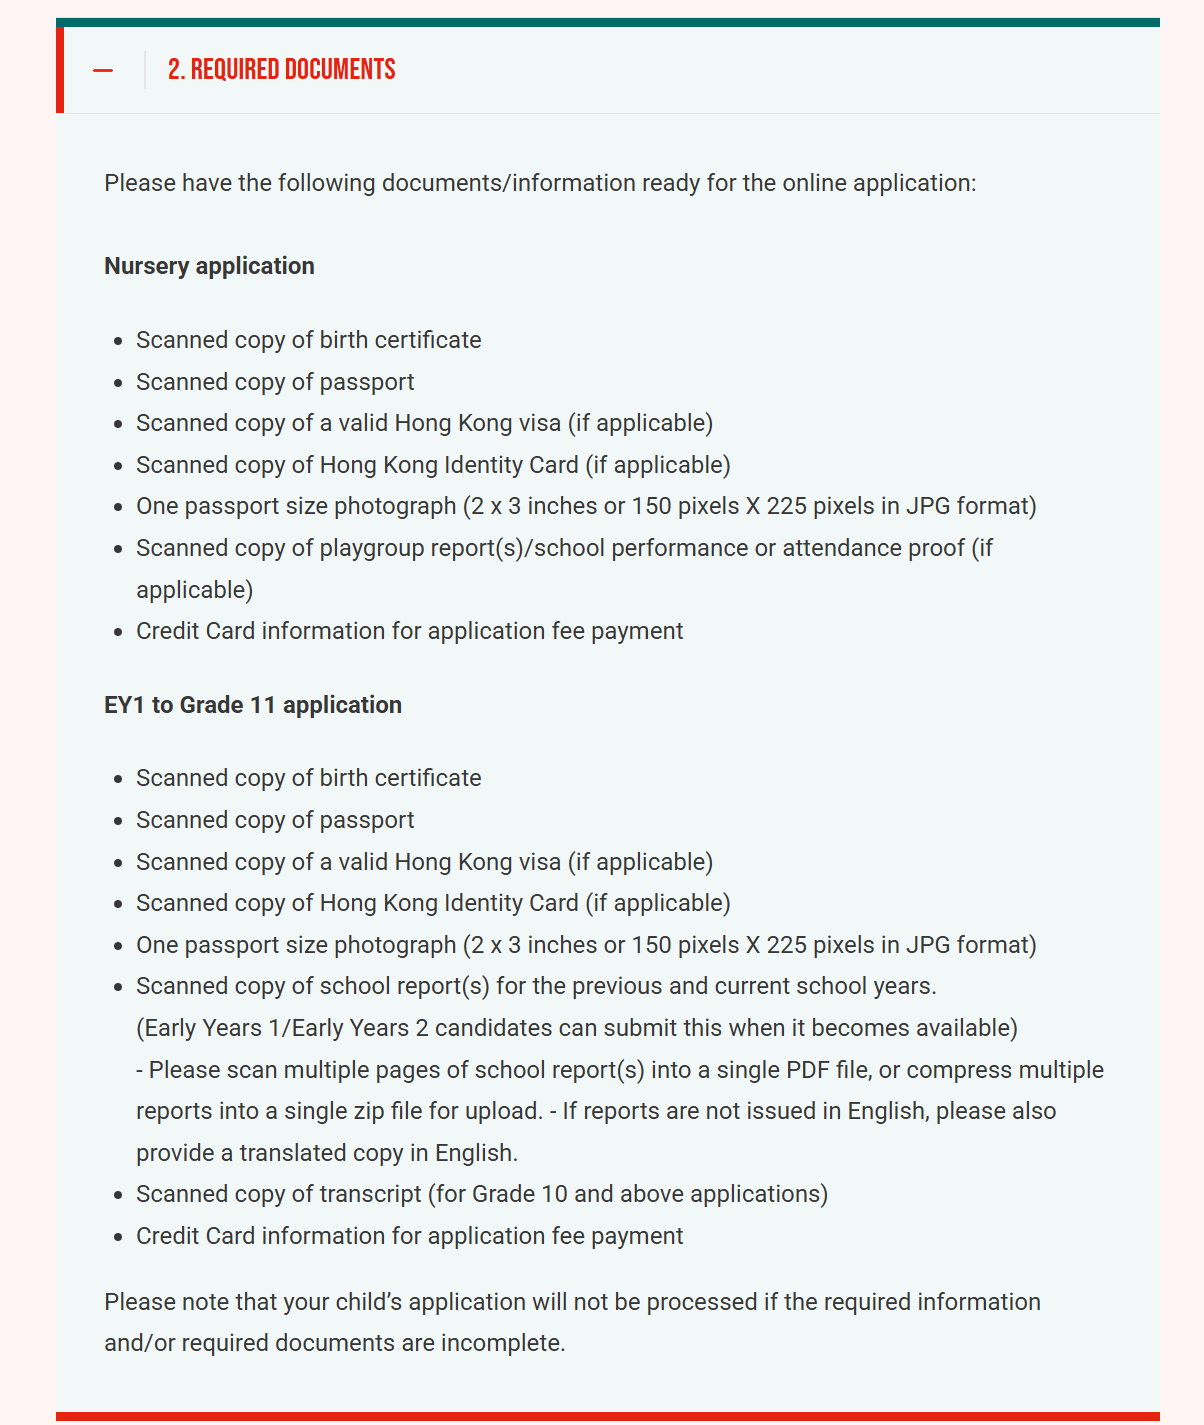
Application Requirements
| No. | Materials |
|---|---|
| Grade: EY1 - G11 | |
| 1 | 符合 Age 要求,以 8.31 为 Age Group,Application 幼小 Stage Enrollment 都必须严格符合 Age 要求 |
| 2 | Application必须Submit在校老师的推荐信 |
| 3 | G2及以下的Application必须在Deadline日期前Submit,Deadline日期后Submit的不会考虑 |
| 4 | G3以上的Application,即使在Deadline日期后Submit,也可能根据学位空缺情况给予考虑 |
| 5 | 面试Stage考察Chinese和English两种Language,中English必须达到能流畅沟通的水平 |
Application Process
| No. | Steps |
|---|---|
| Grade: PN - G11 | |
| 1 | 网上填写Application表,Website填写Application表,分为Sign up账户和正式Application两部分 |
| 2 | 填写Application表过程中,Submit要求的各项证件和Reference |
| Grade: EY1 - G11 | |
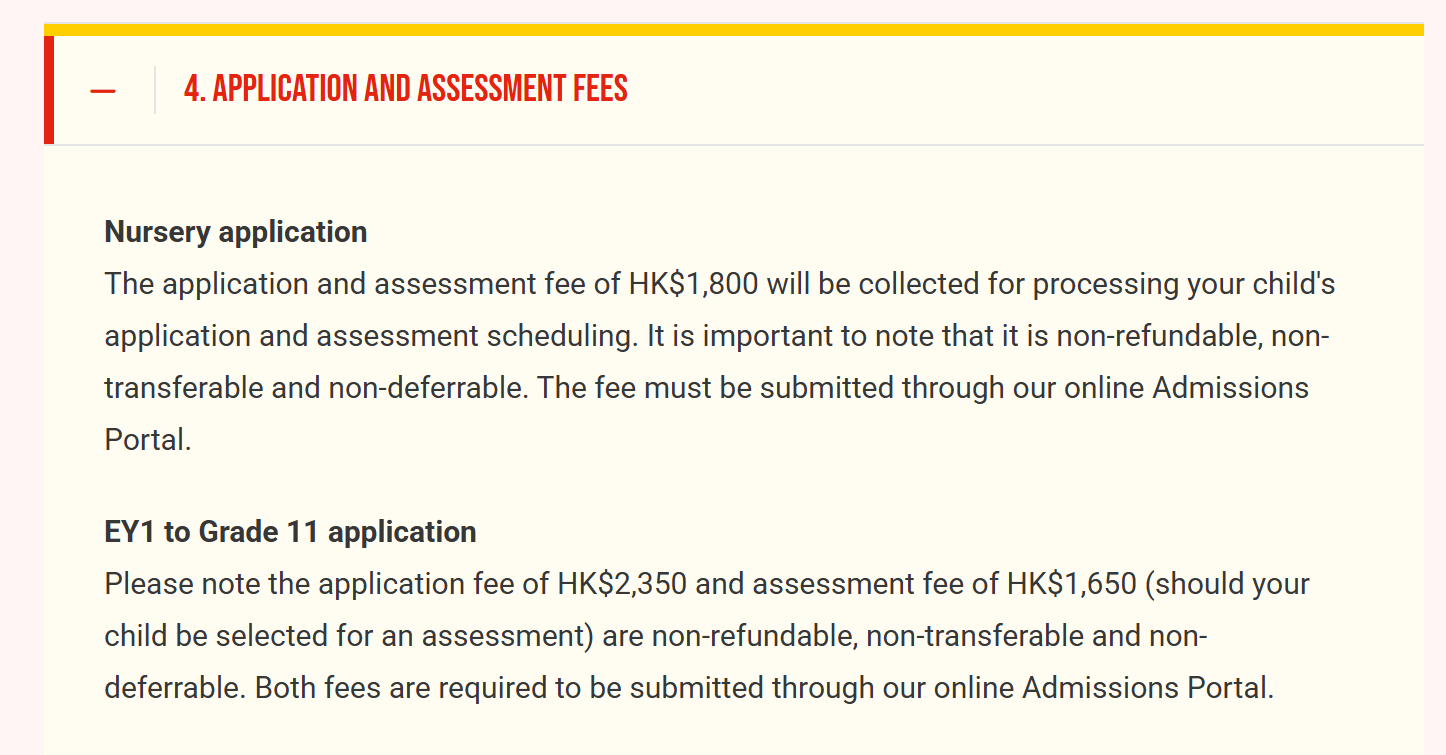
| 1 | Application 人在校老师 Submit 推荐信给 Canada International Schools |
| 2 | Application 系统内线上缴纳 Application 费 HK$2,350 元(注:后续 Assessment Stage 还须缴纳 HK$1,650Assessment 费) |
| 3 | 等待 Profile Email 通知安排面试/笔试 |
| 4 | 完成笔试/面试后一个月左右获得Application结果 |
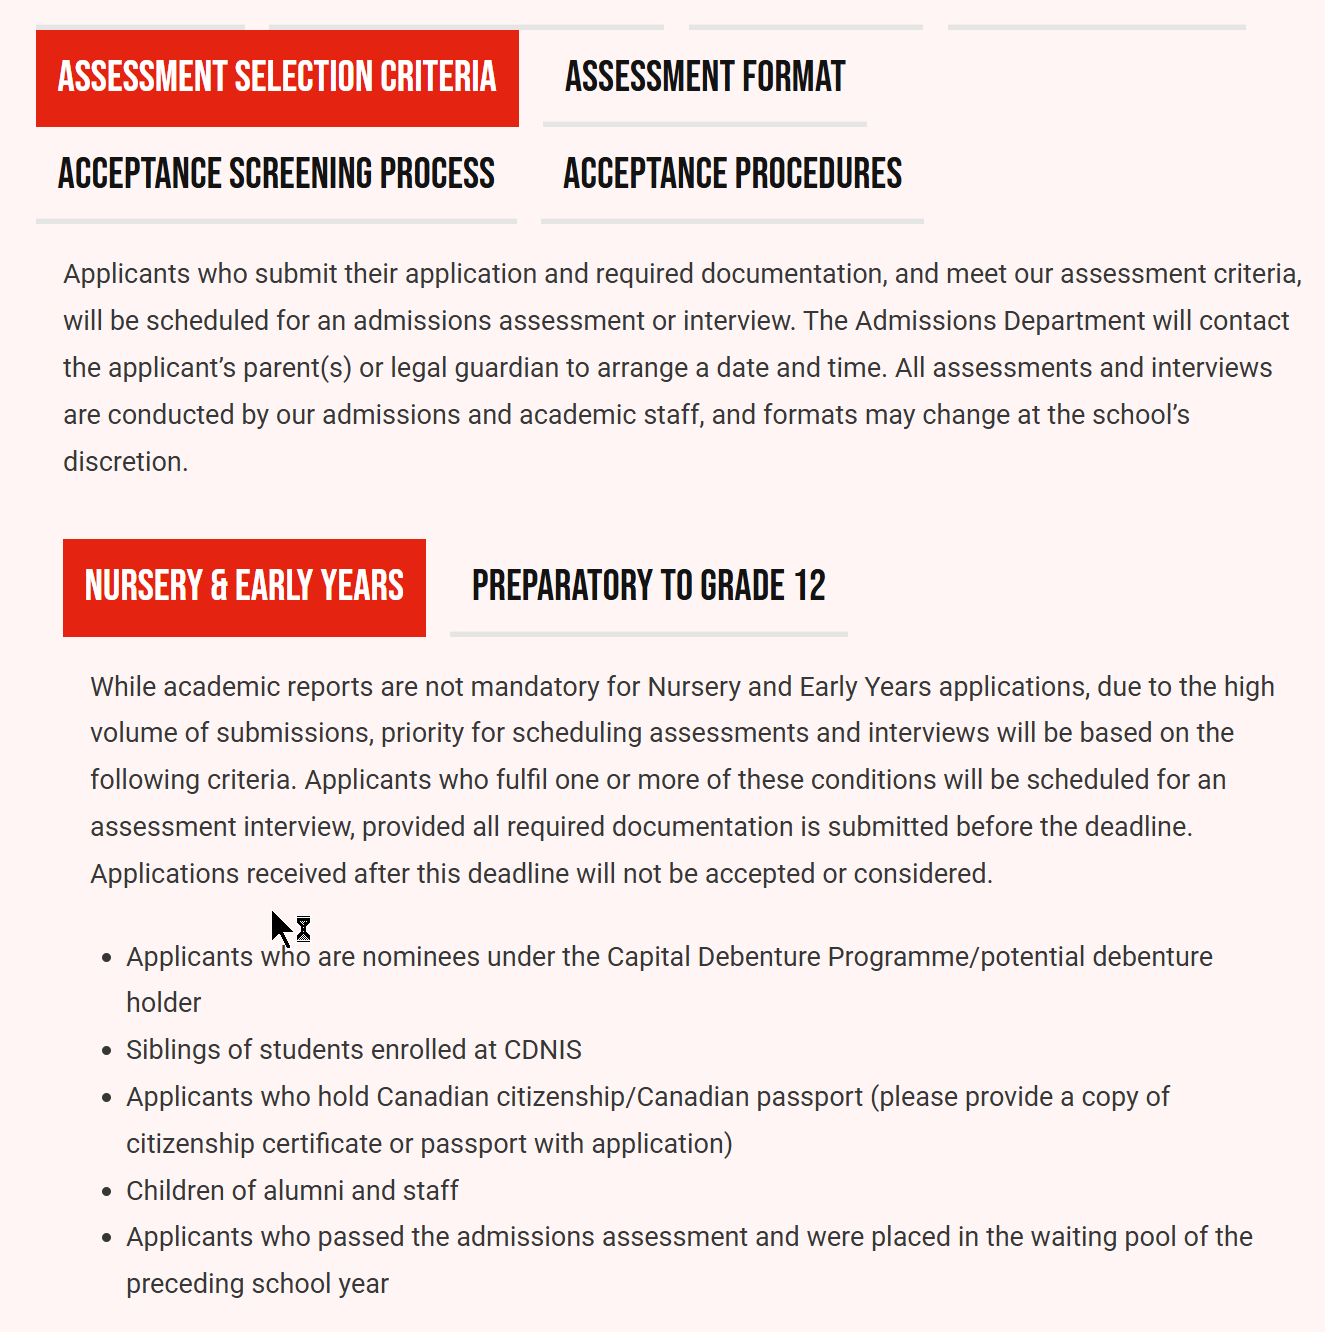
Admission Assessment
| No. | Assessment |
|---|---|
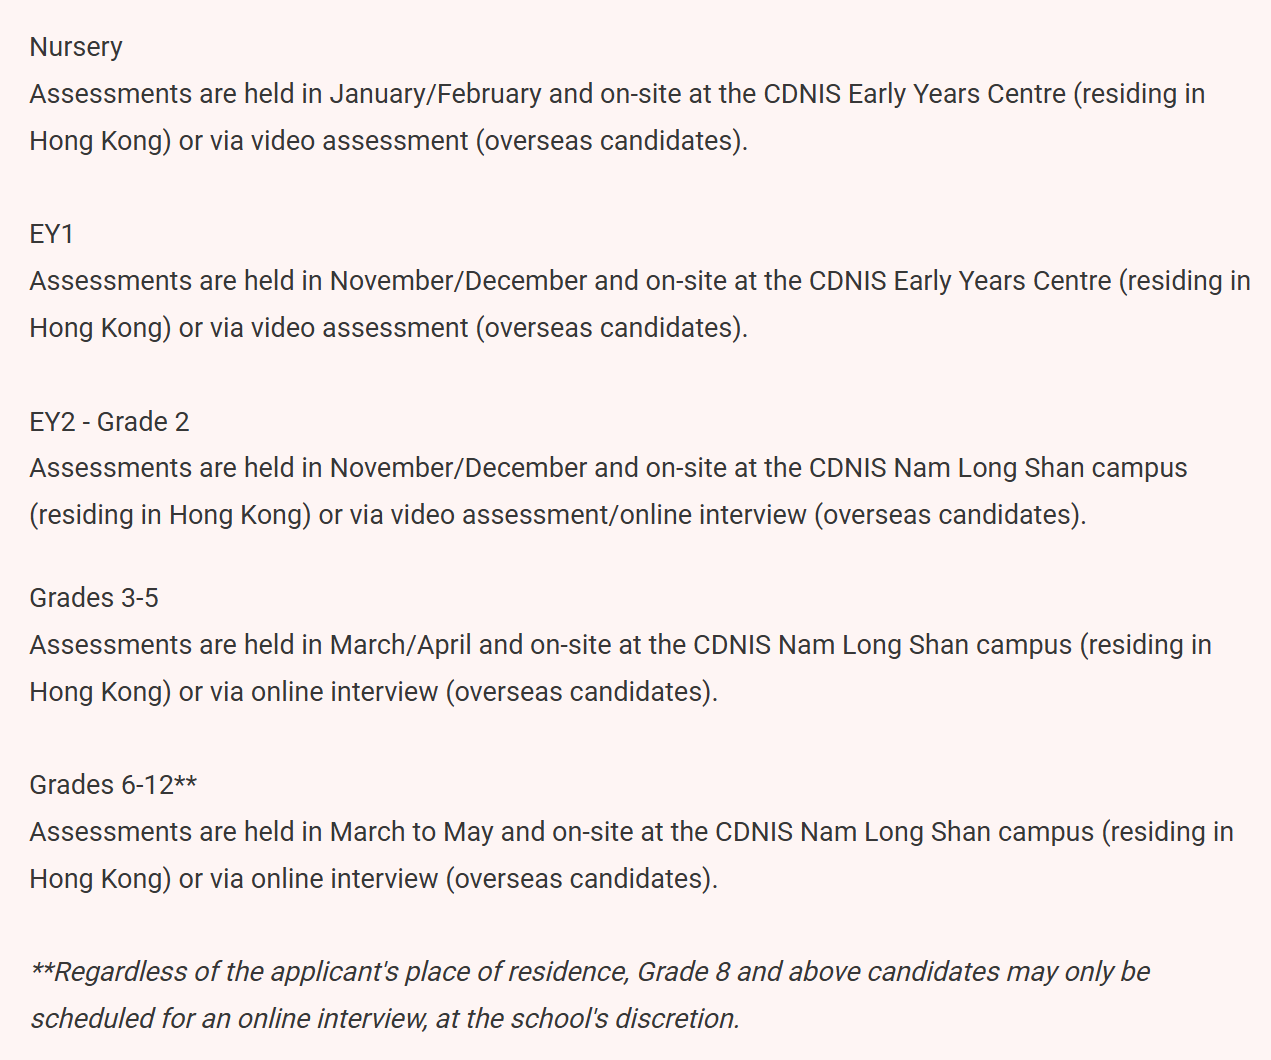
| Grade: PN | |
| 1 | Assessment在一月/二月进行,地点在CDNIS早期教育中心(居住在Hong Kong)或通过视频Assessment(Overseas候选人)。持续时间:45到60分钟 基于游戏的面试、团体Activities以及初学者英语/Mandarin对话的机会 审查游戏小组/幼儿园的Profile报告和Profile推荐信(如适用) |
| Grade: EY1 | |
| 1 | Assessment在十一月/十二月进行,地点在CDNIS早期教育中心(居住在Hong Kong)或通过视频Assessment(Overseas候选人)。持续时间:45到60分钟 基于游戏的面试、团体Activities以及初学者英语/Mandarin对话的机会 审查游戏小组/幼儿园的Profile报告和Profile推荐信(如适用) |
| Grade: EY2 - Prep | |
| 1 | Assessment在十一月/十二月进行,地点在CDNIS Nam Long Shan校区(居住在Hong Kong)或通过视频Assessment/在线面试(Overseas候选人)。持续时间:45到60分钟 基于游戏的面试、团体Activities以及基本英语/Mandarin对话的机会 审查游戏小组/幼儿园的Profile报告和Profile推荐信(Students推荐表) |
| Grade: G1 - G2 | |
| 1 | Assessment在十一月/十二月进行,地点在CDNIS Nam Long Shan校区(居住在Hong Kong)或通过视频Assessment/在线面试(Overseas候选人)。持续时间:60分钟 为该Grade设计的面试,包括个人和小组Activities 内部设计的工作纸,涵盖词汇、写作、阅读、理解、数学和对话技能 审查Profile报告和Profile推荐信(Students推荐表) |
| Grade: G3 - G5 | |
| 1 | Assessment在三月/四月进行,地点在CDNIS Nam Long Shan校区(居住在Hong Kong)或通过在线面试(Overseas候选人)。现场Assessment 持续时间:60分钟 小组Activities和/或 识字测试,撰写About指定主题的短文和/或 与招生/学术工作人员的一对一面试 审查以前和当前学Year的报告、当前学Year“评分”的英语写作样本和数学课堂作业,以及Profile推荐信(Students推荐表) |
| 2 | 在线面试* 持续时间:15到30分钟 与招生/学术工作人员的一对一面试 审查以前和当前学Year的报告、当前学Year“评分”的英语写作样本和数学课堂作业,以及Profile推荐信(Students推荐表) *如果None法为不居住在Hong Kong的Application者安排现场Assessment,将进行在线面试。 |
| Grade: G6 - G12 | |
| 1 | Assessment在三月至五月进行,地点在CDNIS Nam Long Shan校区(居住在Hong Kong)或通过在线面试(Overseas候选人)。 |
| 2 | 现场Assessment 持续时间:1到1.5小时 小组Activities和/或 识字测试,撰写About指定主题的短文和/或 与招生/学术工作人员的一对一面试 审查以前和当前学Year的报告、当前学Year“评分”的英语写作样本和数学课堂作业、Profile推荐信(Students推荐表)以及正式Results单(适用于10Grade及以上) 可提供当前学Year的标准化测试结果(可选) |
| 3 | 在线面试* 持续时间:15到30分钟 与招生/学术工作人员的一对一面试 审查以前和当前学Year的报告、当前学Year“评分”的英语写作样本和数学课堂作业、Profile推荐信(Students推荐表)以及正式Results单(适用于10Grade及以上) 可提供当前学Year的标准化测试结果(可选) *如果None法为不居住在Hong Kong的Application者安排现场Assessment,将进行在线面试。 |
Sources
ApplicationReference
Application费用
ApplicationSteps
Application日期
Application优先权
×
1 / 1
Activities
Regular Sports Activities
篮球、排球、网球、足球、羽毛球、投球、游泳
Special Sports Activities
中国武术、体操、攀岩、击剑、划艇、越野、高尔夫球、飞碟、跳绳、跆拳道、自卫
Team Sports
击剑、游泳、网球、足球、投球、篮球、越野、羽毛球
Music Arts
中国弦乐器、尤克里里、流行音乐乐团、创意声乐、手风琴、摇滚音乐
Drama Arts
English电影、电影编辑
Dance Arts
Hip Hop、霹雳舞和DJ
Design Arts
多媒体和数码艺术、国画、想象艺术、刷子艺术、美术工作室
Direct Language Activities
德语、西班牙语、Japanese、法语、Mandarin
Language-related Activities
讲故事、创意声音与故事、Chinese朗诵、Chinese演讲
STEM Academic Activities
科学探险
STEM Robotics Activities
游戏和动画编程、机器人编程、None人机编程
Other Clubs or Groups
烹饪、园艺、摄影、International象棋
Activity Description
Canada International 的课外 Activities 很丰富,自己开办的部分体育 Curriculum 免费,外面第三方机构开办的 Curriculum 收费,部分 Curriculum 费用低至 600-1500 元,不分 Curriculum 就高至 6000 元以上。
More Links
Summer Camp
暑期班Curriculum非常丰富,涵盖运动、艺术、Language等方面。
Scholarship
Eligibility
- 目前为 CDNIS 的 10Grade Students。
- 承诺会继续在CDNIS就读11Grade和12Grade。
- 展现出优秀的学术能力。
- 在课外Activities中担任领导角色。
- 参与校内和/或校外的服务Activities。
Application Process
- 询问Profile招生办公室
Meal|Bus|Uniform
Meal Service
- Vendor: 美心集团
- Quality Score: 5/5
- Phone: (852) 2101 1363
- Email: CateringServicesDivision@maxims.com.hk
School Bus Service
- Vendor: 冠忠巴士
- Phone: (852) 3193 9363
- Email: cdnis@kcm.com.hk
- Routes & Fees
Uniform Service
- Vendor: Untold Horizons
- Phone: (852) 2367 2001
- Email: contact@untoldhorizons.com.hk
- Purchase Platform
Living
Strengths
- Canada International Schools 的 School Bus 是强制所 Yes Students 必须乘坐的,但也是免费的。所以可以适当住 Yes 一段 Distance 的 Estate。离 Profile Walking Distance 的 Estate 为黄竹坑地铁站上盖的晋环和扬海,以及离地铁站不远的深湾九号。
- 鸭脷洲的深水湾径、南湾、南岸、深湾轩、海怡半岛,Distance Profile Yes 一段 Distance,早上上车时间是 7 点,乘坐 School Bus 方便快捷,Commute 舒适度甚至高于要 Walking 到校的 Estate。
Neutral
- Hong Kong Island Eastern District,如北角和太古一带的 Estate,以及中部天后、炮台山的 Estate,早上上车时间都在 7 点左右,也是 Compare 合适的上学时间。
- 薄扶林的Estate,如贝沙湾、碧瑶湾,早上上车时间是6:50,到校也Compare方便。
Weaknesses
- 西半山和东半山片区都 Yes School Bus 到达,这个片区都是豪宅为主,对居住品质要求高的可以考虑,早上 School Bus 上车时间在 6:40 左右,相对较早。
- 跨海的Kowloon一带的Estate,上车时间在6:30以前,属于最早的上车时间,Commute会Compare辛苦。
Living & Commute Recommendations
School bus route information is available for this school.
View School Bus Route
| # | Estate | Best Commute | Commute Time | Distance | Overall Score |
|---|---|---|---|---|---|
| Loading... | |||||
Note: Monthly rent/total price are estimates based on government RVD monthly residential averages by area and size, for school-living decisions only.
-
FAQ
在双语Curriculum中,课堂时间的50%使用英语,50%使用Mandarin。Students在整个Profile日中沉浸在每种目标Language中,由英语和Chinese教师轮流授课,交替进行。所Yes课堂都Yes双语教育助理(EA),以支持教师和Students的教学与学习,以及提供关怀。早期教育1(EY1)和全天早期教育2(EY2)Classes还分配了额外的EA以提供More支持。
EY2与EY1类似,通过交替的目标Language授课提供50%的Chinese和50%的英语沉浸。延长的学习时间使Students能够在目标Language中参与更广泛的学习Activities。Students可以深入探究不同主题,并参与艺术、体育和音乐等双语专业Curriculum。此外,他们还Yes专门的时间进行午餐、户外Activities和休息。
早期教育到预备Stage的双语Curriculum与整个Profile的Chinese学习Curriculum一致,使用Traditional ChineseChinese。在早期Language学习中,听说能力的培养更为重要,而阅读和写作的重视程度较低。Students在这一Stage接触Traditional Chinese字,并参与适合Age的预阅读和预写作练习,以熟悉基本的汉字。拼音将在二Grade引入,以帮助Students在不混淆的情况下首先打下英语字母、语音意识和拼读的基础。
与英语 Language Curriculum 类似,Chinese 学习将遵循 PYPCurriculum 框架。在 Chinese 读写能力发展的 Curriculum 内容选择方面,相关文本和 Materials 来自 Mainland China、Hong Kong、台湾和新加坡,以构建 Students 对汉字和读写工具的知识,涵盖多种 Materials。
双语 Curriculum 的 Chinese 水平 Assessment 选项包括参考 Hong Kong 的 National 性系统 Assessment(TSA)以及初级汉语水平考试(HSK),还 Yes 来自 United States 和 United Kingdom 的在线 Chinese 水平 Assessment(涵盖初学者到高级水平)。在早期教育和预备 Stage,不会进行外部 Assessment,因为 Students Age 较小,不适合此类 Assessment。与英语的 MAP 成长测试类似,这些测试选项将在后期的低 Grade 实施时考虑。
不需要。Debenture 不是强制性的。然而,持 Yes Debenture 的人在满足 Admission Assessment 要求时会享 Yes 优先权。请参阅网站上的“在线 Application”部分中的“接受 Filter 流程”。被 CDNISOffers 的 Students 必须支付 Year 度资本费或持 Yes Debenture。
通过 Admission Assessment/面试的 Application 者将在 Application 的学 Year 中被放入候补池,当招生名额已满且 No 立即可用的座位时。候补池不会延续到后续学 Year,Application 者必须为下一个学 Year 重新 Submit Application。
虽然幼儿园和早期教育的 Application 不要求提供学术报告,但由于 Submit 量较大,Assessment 和面试的安排优先考虑以下标准。满足一个或多个条件的 Application 者,确保在 Deadline 日期 Oct2 日之前 Submit 所 Yes 所需文件,将被安排进行 Assessment 面试。Deadline 日期后收到的 Application 将不被接受或考虑。 - 资本 Debenture 计划的提名人/潜在 Debenture 持 Yes 者 - 在 CDNIS 就读的 Students 的兄弟姐妹 - 持 Yes Canada 国籍/Canada 护照的 Application 者(请在 Application 中提供国籍证书或护照的复印件) - 校友和员工的子 Girls - 在前一个学 Year 通过 Admission Assessment 并被放入候补池的 Application 者