
Diocesan Girls' School
Diocesan Girls' School
- DGS
全港最顶尖的女校,历年来HKDSE成绩都和香港圣保罗男女中学不相上下,小学非年级前三名都很难考进这所中学。
Overview
School Info
Band
Band 1a
School Gender
Girls
School Net
School Net Tsm
Primary联系
Diocesan Girls' Junior School
Curriculum Type
ProfileType
Direct Subsidy Scheme
直升安排
Through-train
Curriculum Features
Hong Kong本地→DSE+AL
Classes & Students
Age Group
12.31
Grade Setup
G7 - G12(S1 - S6)
Classes Count
5
Students / Class
32 - 41
Total Students
1,200 - 1,300
Teaching Language
Teaching Language
English
Chinese Characters
Traditional Chinese
Religion
Religion
Christianityity
Founded
1860
School Hours
7:55 am - 3:00 pm
费用情况
Annual Tuition
HK$40,000
Other
Boarding Service
提供60个寄宿床位
Entrance Exam
Chinese/English/Math Paper / English Interview / Cantonese Interview
Application Info
Minimum Application Grade
S1
Maximum Application Grade
S4
Eligible Application Grades
S1 / S2 / S3 / S4
Application Method
Online then In-person
Transfer Application Opens
2025/4/15
Transfer Application Deadline
2025/4/29
Useful Links
Contact
Phone
(852) 2277 9100 / 2277 9100
Email
info@dgs.edu.hk
Address
Hong Kong油麻地佐敦道一号
Map Location
拔萃Girls書院
Relation
Fees
Fee Information
| Grade | School Level | Age | Fees | Stage |
|---|---|---|---|---|
| G1 | P1 | 6 | $86,000 | 小一 |
| G2 | P2 | 7 | $86,000 | 小二 |
| G3 | P3 | 8 | $86,000 | 小三 |
| G4 | P4 | 9 | $86,000 | 小四 |
| G5 | P5 | 10 | $86,000 | 小五 |
| G6 | P6 | 11 | $86,000 | 小六 |
| G7 | S1 | 12 | $42,000 | 中一 |
| G8 | S2 | 13 | $42,000 | 中二 |
| G9 | S3 | 14 | $42,000 | 中三 |
| G10 | S4 | 15 | $42,000 | 中四 |
| G11 | S5 | 16 | $42,000 | 中五 |
| G12 | S6 | 17 | $42,000 | 中六 |
Primary P1 - P6$86,000
School-based Curriculum
Secondary S1 - S6$42,000
本地 Students HKDSE
Secondary S1 - S3$118,316
非本地 Students HKDSE
Secondary S4 - S6131,786
非本地 Students HKDSE
Other Fees
Boarding FeeHK$65,000
Sources

×
1 / 1
Exam
AI Insights
结论: 稳居全港DSE排名第2,但高分段表现(5+及A率)较往年有明显下滑。
要点:
- DSE全港排名第2,虽稳居顶尖梯队,但大学门槛(332A)达标率下降3%至94%。
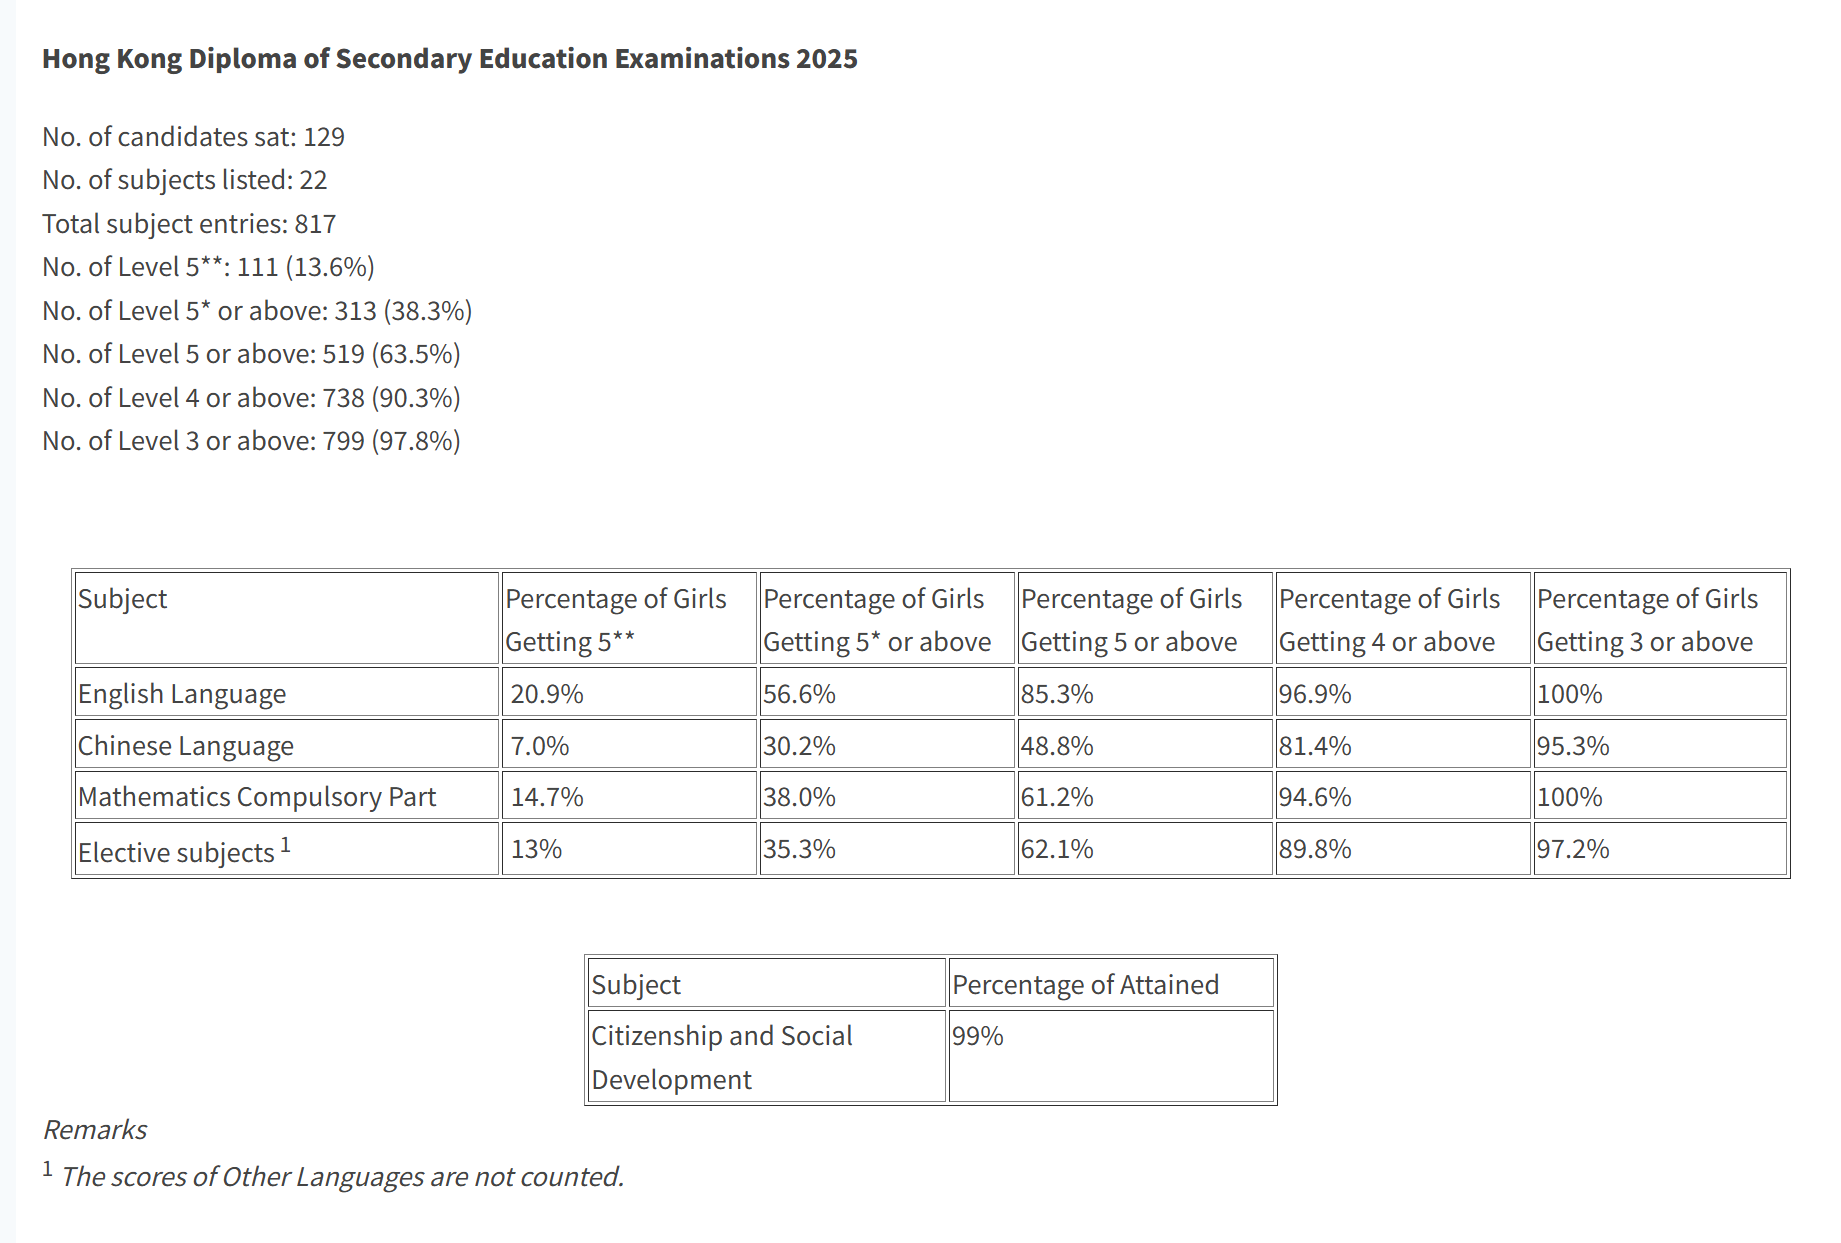
- 高分段(5+)总分率下降7.7%,其中数学5+由76%大幅跌至61.2%,波动明显。
- 中文科表现逆势上升,5+率提升1.8%,4+率显著增长5.4%,学科优势有所增强。
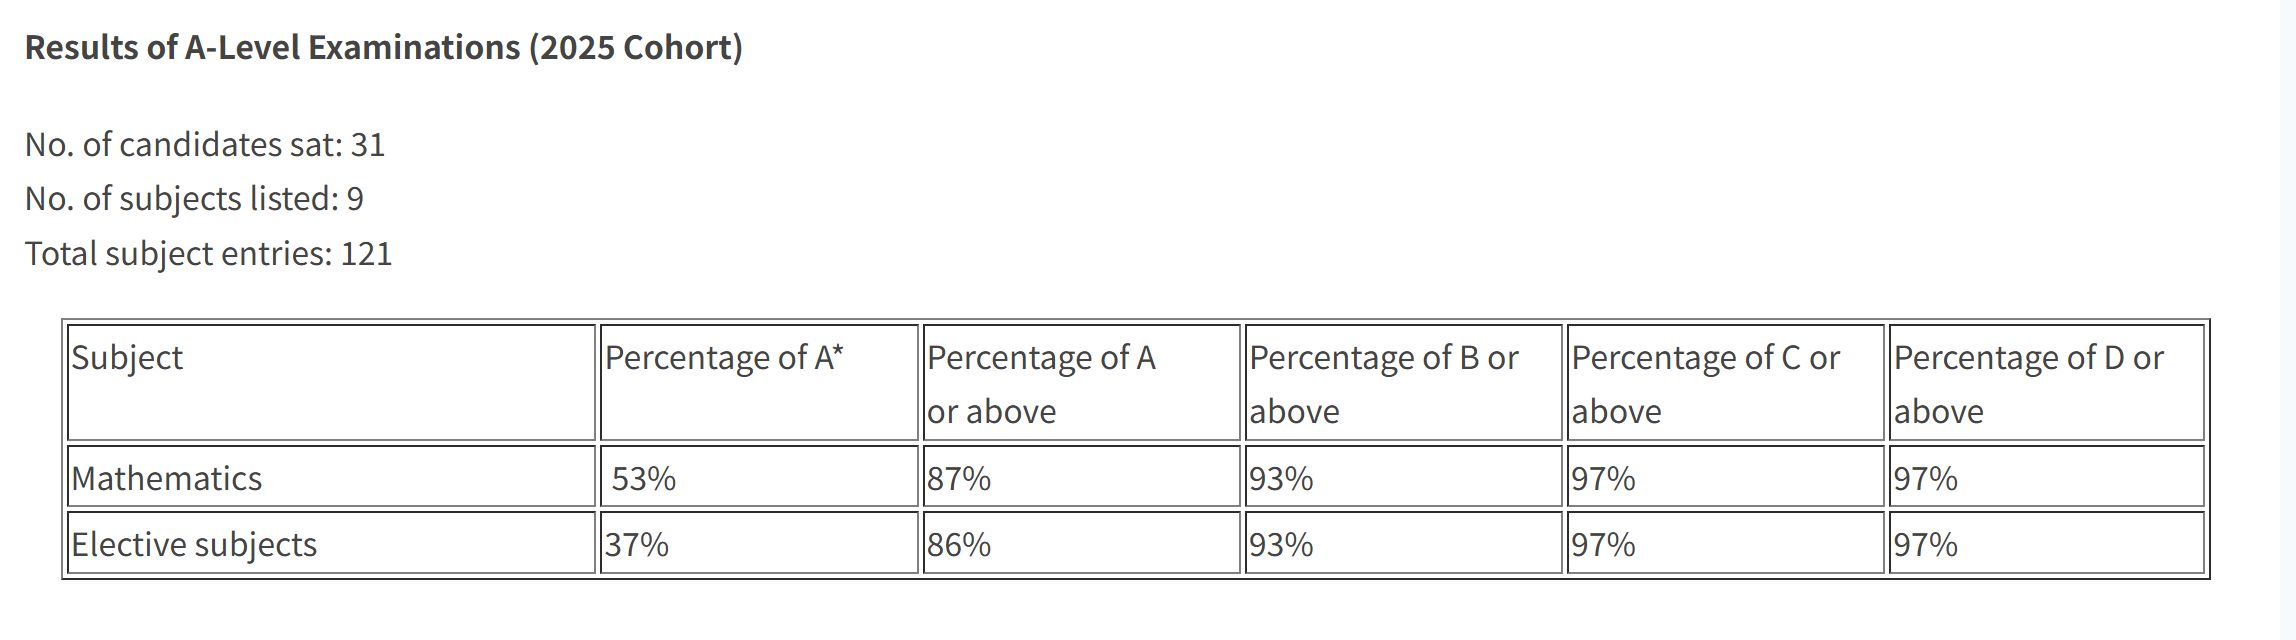
- A Level成绩分化,A率由52%降至37%,但A/A优良率提升至86%。
- DSE考生人数增加23人,规模扩大的同时,5及5等顶尖比例出现5%-9%的跌幅。
建议: 需重点关注数学及选修科的高分段突破,针对DSE考生规模扩大后的差异化教学进行质量把控。
DSE Ranking
Rank 2 / 309
Higher Ranked
Lower Ranked
DSE Overview
| Metrics | 2025 | 2024 | 2023 | Change |
|---|---|---|---|---|
| Key Metrics | ||||
| 332A (Universities门槛) | 94.0% | 97.0% | 96.0% | ▼ 3.0% |
| 332A Notes | JUPASOffers率 | JUPASOffers率 | JUPASOffers率 | - |
| 222A (副学士) | 98.0% | 99.0% | 99.0% | ▼ 1.0% |
| 公民科合格率 | 99.0% | 100.0% | - | ▼ 1.0% |
| Level 5+ (优秀) | ||||
| Total 5+ | 63.5% | 71.2% | 70.6% | ▼ 7.7% |
| 5** | 13.6% | 19.4% | 19.6% | ▼ 5.8% |
| 5* | 38.3% | 47.9% | 46.4% | ▼ 9.6% |
| CEM 5+ (主科) | 65.1% | 70.0% | 74.7% | ▼ 4.9% |
| Chinese 5+ | 48.8% | 47.0% | 59.0% | ▲ 1.8% |
| English 5+ | 85.3% | 87.0% | 93.0% | ▼ 1.7% |
| 数学 5+ | 61.2% | 76.0% | 72.0% | ▼ 14.8% |
| 选修科 5+ | 62.1% | 72.0% | 69.0% | ▼ 9.9% |
| Level 4+ (良好) | ||||
| Total 4+ | 90.3% | 89.1% | 90.2% | ▲ 1.2% |
| CEM 4+ (主科) | 91.0% | 89.7% | 91.3% | ▲ 1.3% |
| Chinese 4+ | 81.4% | 76.0% | 83.0% | ▲ 5.4% |
| English 4+ | 96.9% | 98.0% | 98.0% | ▼ 1.1% |
| 数学 4+ | 94.6% | 95.0% | 93.0% | ▼ 0.4% |
| 选修科 4+ | 89.8% | 88.0% | 88.0% | ▲ 1.8% |
| Level 3+ (及格) | ||||
| Total 3+ | 97.8% | 98.2% | 97.4% | ▼ 0.4% |
| CEM 3+ (主科) | 98.4% | 99.0% | 97.7% | ▼ 0.6% |
| Chinese 3+ | 95.3% | 97.0% | 96.0% | ▼ 1.7% |
| English 3+ | 100.0% | 100.0% | 99.0% | - |
| 数学 3+ | 100.0% | 100.0% | 98.0% | - |
| 选修科 3+ | 97.2% | 98.0% | 96.0% | ▼ 0.8% |
| 人数 | ||||
| DSE Candidates | 129 | 106 | 122 | ▲ 23 |
| Non-DSE Candidates | 31 | 34 | - | ▼ 3 |
Other Exam Results
A Level Results
| Item | 2025 | 2024 | 2023 |
|---|---|---|---|
| Number of Candidates | 31 | 34 | |
| A Level A* % | 37% | 52% | 57% |
| A Level A*/A % | 86% | 79% | 84% |
Sources
×
1 / 1
Placement
AI Insights
结论:
2025年香港顶尖大学录取率大幅提升,英港名校录取表现强劲,但整体本科率略有下滑。
要点:
- 香港三大录取激增: 香港三大录取率从61.1%显著升至75.97%,增幅达14.9%,本地顶尖竞争力大幅增强。
- 英本G5表现亮眼: 牛剑录取14人(占比8.3%),G5录取高达72人(占比42.9%),英国方向申请质量极高。
- 美本顶尖梯队突破: 成功斩获1枚哈耶普斯麻及5枚藤校录取,美本T20累计录取率达到8.3%。
- 升学分层略有扩大: 联招率与本地本科率分别下降4.0%和1.1%,副学士率由2.9%升至5%。
- 核心院校录取稳健: 帝国理工学院2025年录取15人,虽较去年减少2人,但在高梯队中仍保持高位。
建议:
鉴于香港三大录取率激增及英本G5的高成功率,建议学生在稳固DSE优势的同时,积极规划英港双轨申请。
University Placement Analysis
| Placement Destinations | 2025Year | 2024Year | Change |
|---|---|---|---|
| Hong KongTop 3 Rate | 76.0% | 61.1% | ▲ 14.9% |
| JUPAS Rate | 93.0% | 97.0% | ▼ 4.0% |
| Bachelor and Associate Degree Rate | 94.0% | 97.0% | ▼ 3.0% |
| Hong Kong九大率 | 94.0% | 94.1% | ▼ 0.1% |
| Hong Kong本地本科率 | 93.0% | 94.1% | ▼ 1.1% |
| 副学士学位率 | 5.0% | 2.9% | ▲ 2.1% |
University Tier Analysis
| University Tier | Offers | %% | Cumulative%Cumulative |
|---|---|---|---|
| Total Students | - | - | - |
Detailed University Placement Results
| University Name | 25 Matriculations25 Matric. | 25 Matric. %25 % | 24 Matriculations24 Matric. | 24 Matric. %24 % | QS | US | THE | Country |
|---|---|---|---|---|---|---|---|---|
The University of Hong Kong | 52 | 40.3% | 11 | 5.4% | 11 | - | - | 中国Hong Kong |
The Chinese University of Hong Kong | 28 | 21.7% | 32 | 15.7% | 32 | - | 43 | 中国Hong Kong |
The Hong Kong University of Science and Technology | 18 | 14.0% | 44 | 21.6% | 44 | - | 60 | 中国Hong Kong |
The Hong Kong Polytechnic University | 9 | 7.0% | 54 | 26.5% | 54 | - | 80 | 中国Hong Kong |
City University of Hong Kong | 11 | 8.5% | 63 | 30.9% | 63 | - | 73 | 中国Hong Kong |
Saint Francis University | 1 | 0.8% | - | - | - | - | - | 中国Hong Kong |
The Education University of Hong Kong | 2 | 1.6% | - | - | - | - | - | 中国Hong Kong |
Others/National Service | 7 | 5.4% | - | - | - | - | - | Other |
Data Notes
Matriculation counts students who finally enroll at a university. Since each student enrolls in only one university, total matriculations usually do not exceed total graduates.
Offer counts admission offers received by students. A student may receive multiple offers, so total offers are usually higher than total graduates.
| University Name | 25 Matriculations25 Matric. | 25 Matric. %25 % | 24 Matriculations24 Matric. | 24 Matric. %24 % | QS | US | THE |
|---|---|---|---|---|---|---|---|
The University of Hong Kong | 52 | 40.3% | 11 | 5.4% | 11 | - | - |
The Chinese University of Hong Kong | 28 | 21.7% | 32 | 15.7% | 32 | - | 43 |
The Hong Kong University of Science and Technology | 18 | 14.0% | 44 | 21.6% | 44 | - | 60 |
The Hong Kong Polytechnic University | 9 | 7.0% | 54 | 26.5% | 54 | - | 80 |
City University of Hong Kong | 11 | 8.5% | 63 | 30.9% | 63 | - | 73 |
Saint Francis University | 1 | 0.8% | - | - | - | - | - |
The Education University of Hong Kong | 2 | 1.6% | - | - | - | - | - |
Living
Living & Commute Recommendations
| # | Estate | Best Commute | Commute Time | Distance | Overall Score |
|---|---|---|---|---|---|
| Loading... | |||||
Note: Monthly rent/total price are estimates based on government RVD monthly residential averages by area and size, for school-living decisions only.
-