
Queen'S College
Queen'S College
- QC
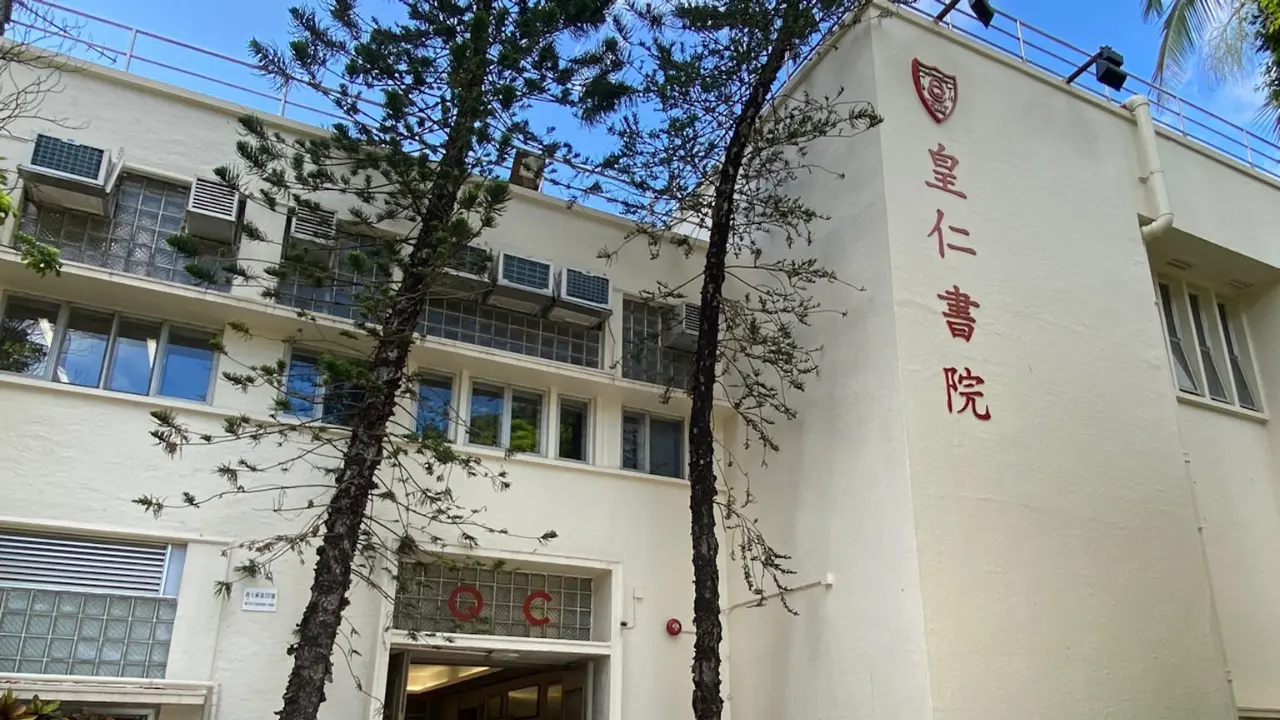
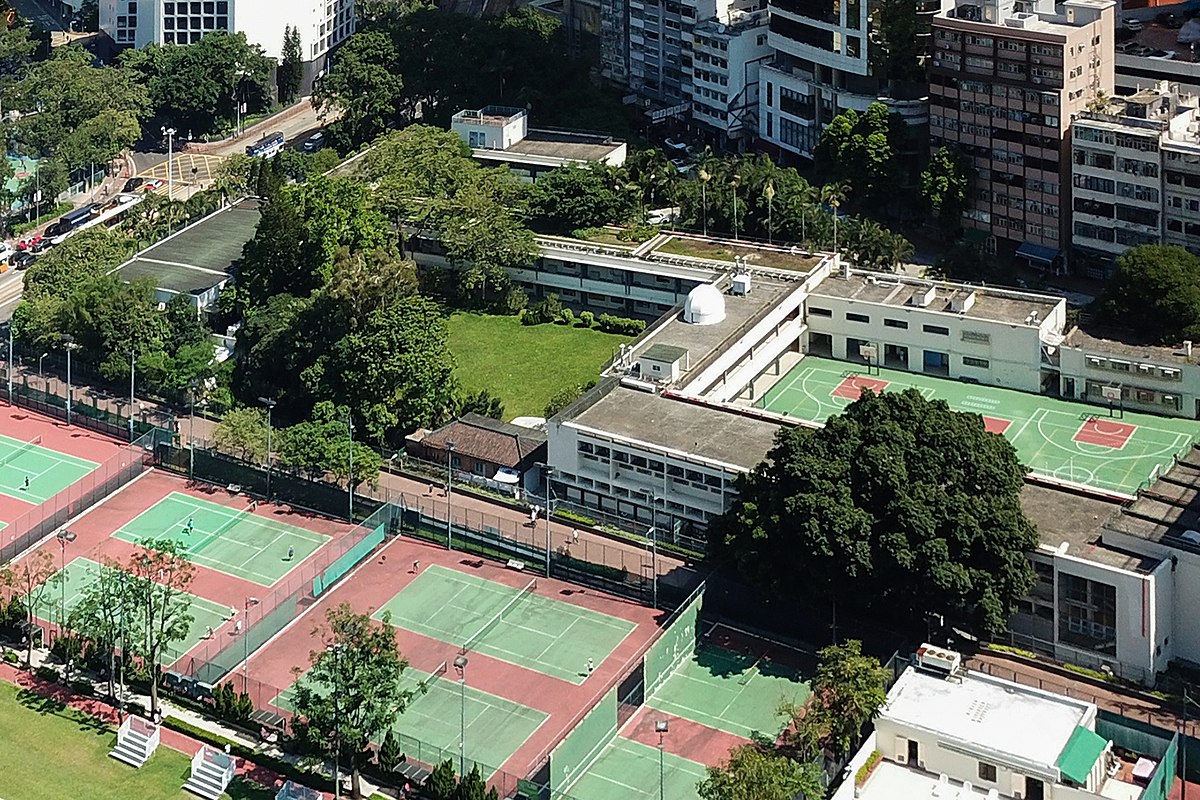
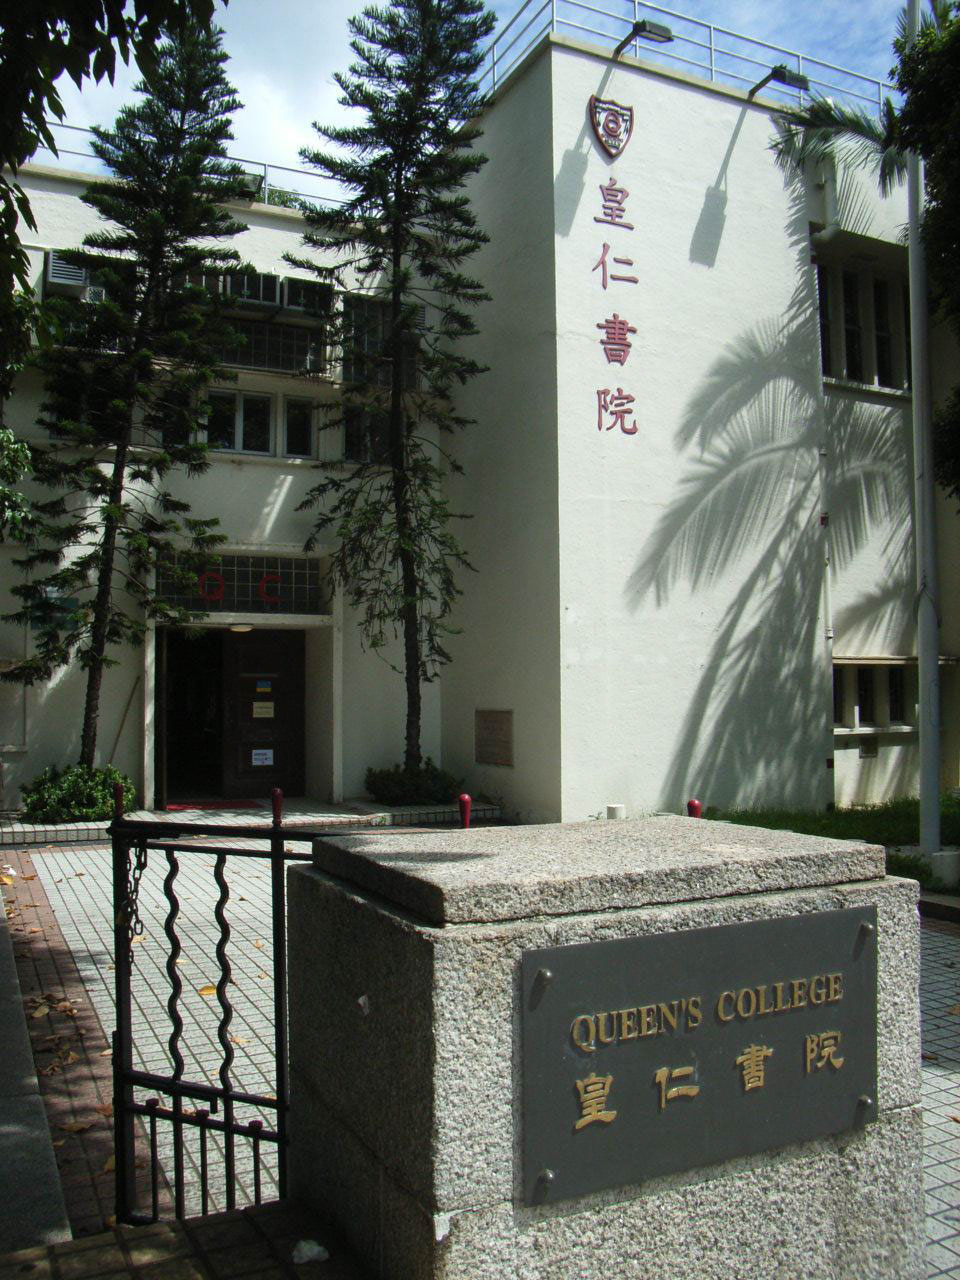
皇仁书院(英语:Queen's College)为香港最早成立的官立中学。1862年于中环歌赋街校舍启用时命名为中央书院(Government Central School,当时又称大书院),及后于1889年迁往中环荷李活道新校舍,1890年政府刊宪改名为维多利亚书院(Victoria College)。1894年,政府再度刊宪易名为皇仁书院(Queen's College)。目前校舍位于香港铜锣湾高士威道,为全港仅有的三家官立男子中学之一。
全港DSE成绩最好的官津中学。
Overview
School Info
Band
Band 1a
School Gender
Boys
School Net
School Net Wc
Primary联系
Aldrich Bay Government Pri Sch / Hennessy Road Government Primary Sch
Curriculum Type
ProfileType
官立
直升安排
Through-train
Curriculum Features
Hong Kong本地→DSE
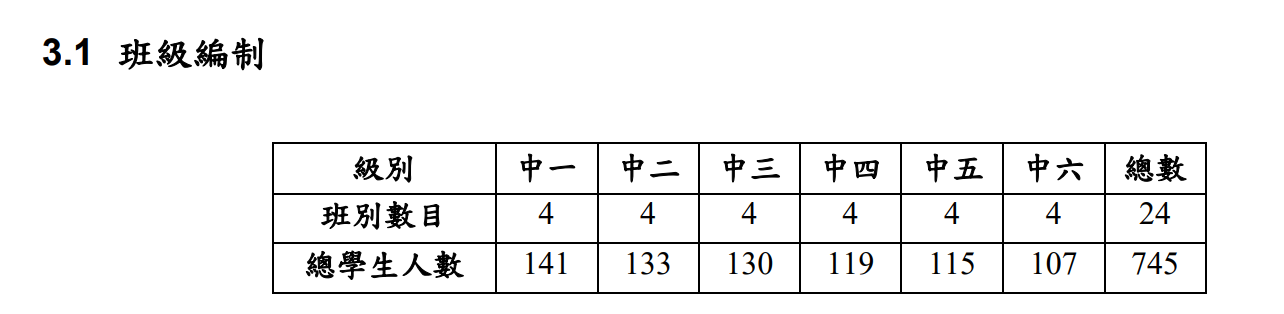
Classes & Students
Age Group
12.31
Grade Setup
G7 - G12(S1 - S6)
Classes Count
4
Students / Class
平均31人/班
Total Students
745人
Teaching Language
Teaching Language
English
Chinese Characters
Traditional Chinese
Religion
Religion
No Religion
Founded
1862
费用情况
Annual Tuition
-
Other
Boarding Service
不提供寄宿
Entrance Exam
Chinese/English/Math Paper / English Interview / Cantonese Interview
Application Info
Minimum Application Grade
S2
Maximum Application Grade
S3
Eligible Application Grades
S2 / S3
Application Method
By Mail / In-person Submission
Transfer Application Opens
2025/5/16
Transfer Application Deadline
2025/6/16
Useful Links
Contact
Phone
(852) 2576 1992 / 2576 1992
Email
qc1@qc.edu.hk
Address
Hong Kong Island Wan Chai 区铜锣湾高士威道 120 号
Map Location
皇仁書院
Student Distribution
Student Enrollment Trend
Select Data Year:
| Grade | 2024-2025 | 2023-2024 | Δ Students | ||||
|---|---|---|---|---|---|---|---|
| Students | Classes | Students / Class | Students | Classes | Students / Class | ||
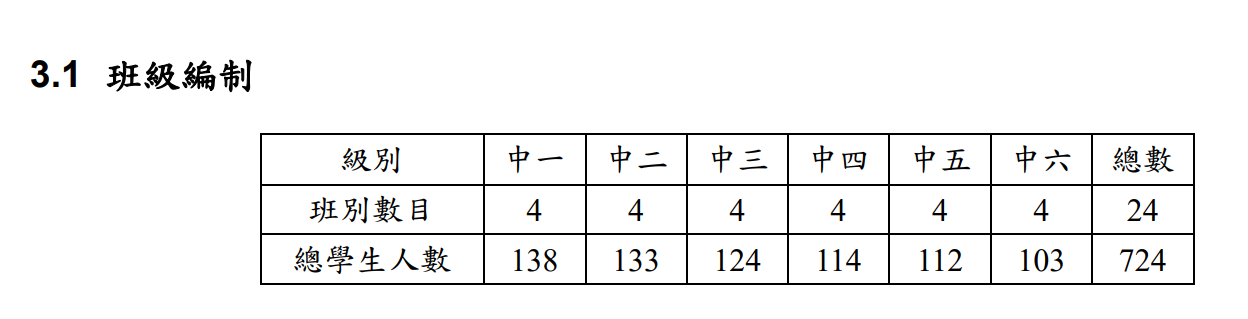
| S1 | 141 | 4 | 35.3 | 138 | 4 | 34.5 | - |
| S2 | 133 | 4 | 33.3 | 133 | 4 | 33.3 | ▼ 5 |
| S3 | 130 | 4 | 32.5 | 124 | 4 | 31 | ▼ 3 |
| S4 | 119 | 4 | 29.8 | 114 | 4 | 28.5 | ▼ 5 |
| S5 | 115 | 4 | 28.8 | 112 | 4 | 28 | ▲ 1 |
| S6 | 107 | 4 | 26.8 | 103 | 4 | 25.8 | ▼ 5 |
| Total | 745 | 24 | 31 | 724 | 24 | 30.2 | ▲ 21 |
* Δ Students = students in this grade this year − students in the lower grade last year. It indicates cohort-size change.
Sources
2024-2025 Student Distribution
2023-2024 Student Distribution
×
1 / 1
Exam
DSE Ranking
Rank 3 / 311
Higher Ranked
Lower Ranked
DSE Overview
| Metrics | 2025 | 2024 | 2023 | Change |
|---|---|---|---|---|
| Key Metrics | ||||
| 332A (Universities门槛) | - | 90.3% | - | - |
| Level 5+ (优秀) | ||||
| Total 5+ | - | 56.8% | - | - |
| CEM 5+ (主科) | 55.4% | 47.3% | 51.2% | ▲ 8.1% |
| Chinese 5+ | 41.0% | 24.5% | 32.0% | ▲ 16.5% |
| English 5+ | 58.0% | 50.5% | 48.6% | ▲ 7.5% |
| 数学 5+ | 67.3% | 67.0% | 72.9% | ▲ 0.3% |
| 人数 | ||||
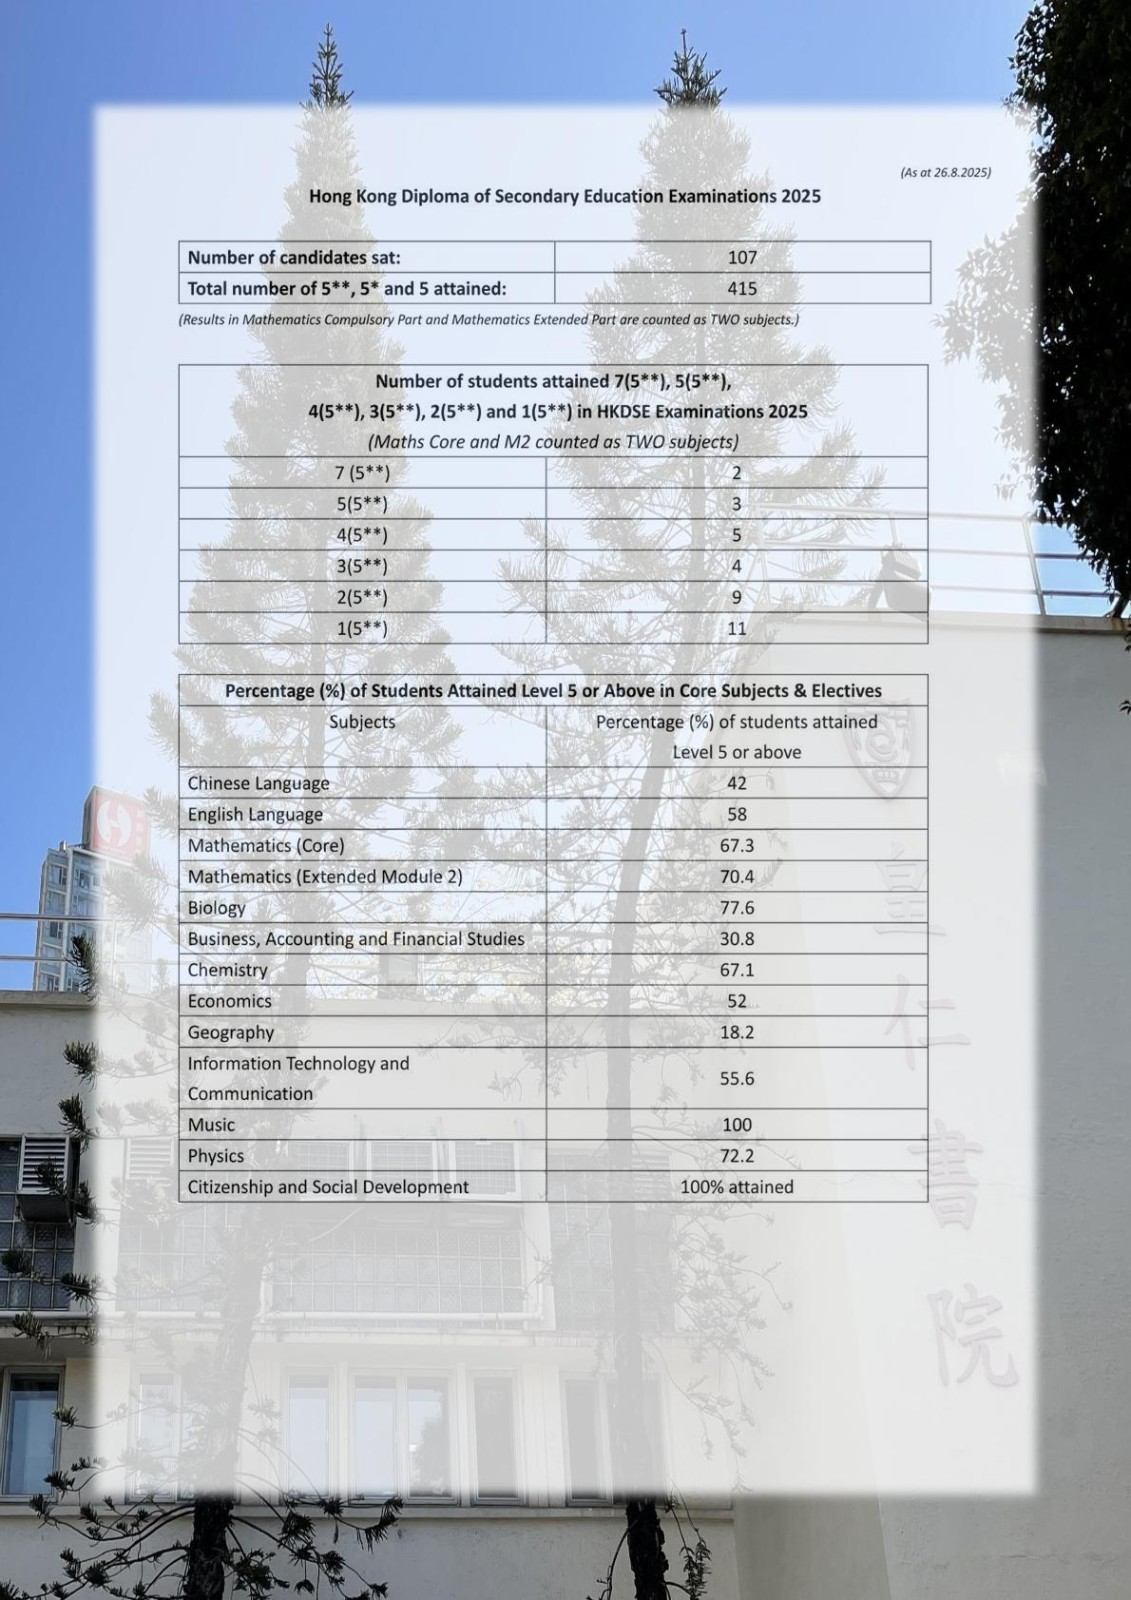
| DSE Candidates | 107 | 103 | 109 | ▲ 4 |
DSE Subject Results
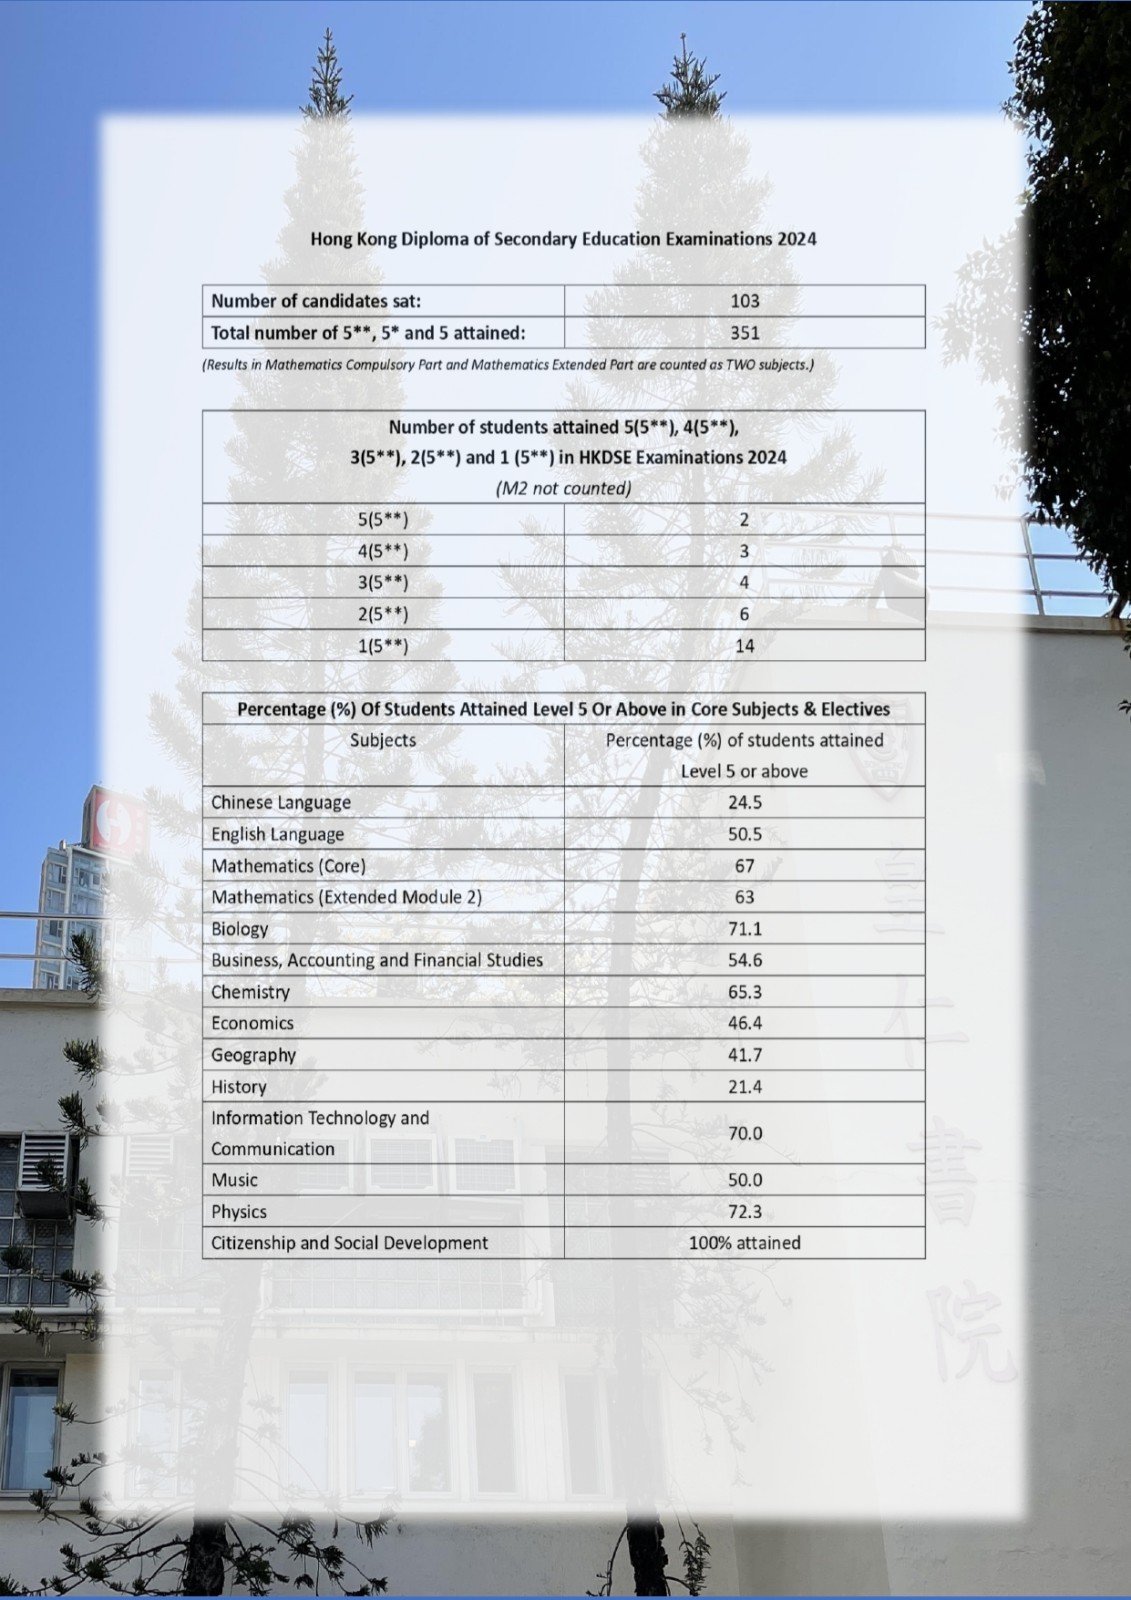
| Subject | 2025 (%) | 2024 (%) | Change |
|---|---|---|---|
| Chinese | 42.0 | 24.5 | ▲ 17.5 |
| English | 58.0 | 50.5 | ▲ 7.5 |
| Compulsory Mathematics | 67.3 | 67.0 | ▲ 0.3 |
| Mathematics M2 | 70.4 | 63.0 | ▲ 7.4 |
| Music | 100.0 | 50.0 | ▲ 50.0 |
| Biology | 77.6 | 71.1 | ▲ 6.5 |
| Physics | 72.2 | 72.3 | ▼ 0.1 |
| Chemistry | 67.1 | 65.3 | ▲ 1.8 |
| ICT | 55.6 | 70.0 | ▼ 14.4 |
| Economics | 52.0 | 46.4 | ▲ 5.6 |
| BAFS Accounting | 30.8 | 54.6 | ▼ 23.8 |
| History | - | 21.4 | - |
| Geography | 18.2 | 41.7 | ▼ 23.5 |
Sources
×
1 / 1
Placement
University Placement Analysis
| Placement Destinations | 2025Year | 2024Year | Change |
|---|---|---|---|
| JUPAS Rate | 89.7% | 89.3% | ▲ 0.4% |
| Bachelor and Associate Degree Rate | 89.7% | 89.3% | ▲ 0.4% |
| 总本科率(本地+Overseas) | 89.7% | 89.3% | ▲ 0.4% |
| Hong Kong本地本科率 | 89.7% | 89.3% | ▲ 0.4% |
| Overseas本科率 | - | 0.0% | - |
| SSSDP Rate | 4.6% | 7.8% | ▼ 3.2% |
| Progression Rate | 89.3% | - |
2025 University Tier Analysis
| University Tier | 2025Enrollment25Enrollment | 2025Enrollment%25% | 2025EnrollmentCumulative%25Cumulative | 2024Enrollment24Enrollment | 2024Enrollment%24% | 2024EnrollmentCumulative%24Cumulative | ΔOffers%Δ% |
|---|---|---|---|---|---|---|---|
| Total Students | 107 | 100.0% | - | 103 | 100.0% | - | - |
| HK Top 3 | 69 | 64.5% | 64.5% | 68 | 66.0% | 66.0% | -1.5% |
| HK Top 4 | 10 | 9.3% | 73.8% | 9 | 8.7% | 74.8% | +0.6% |
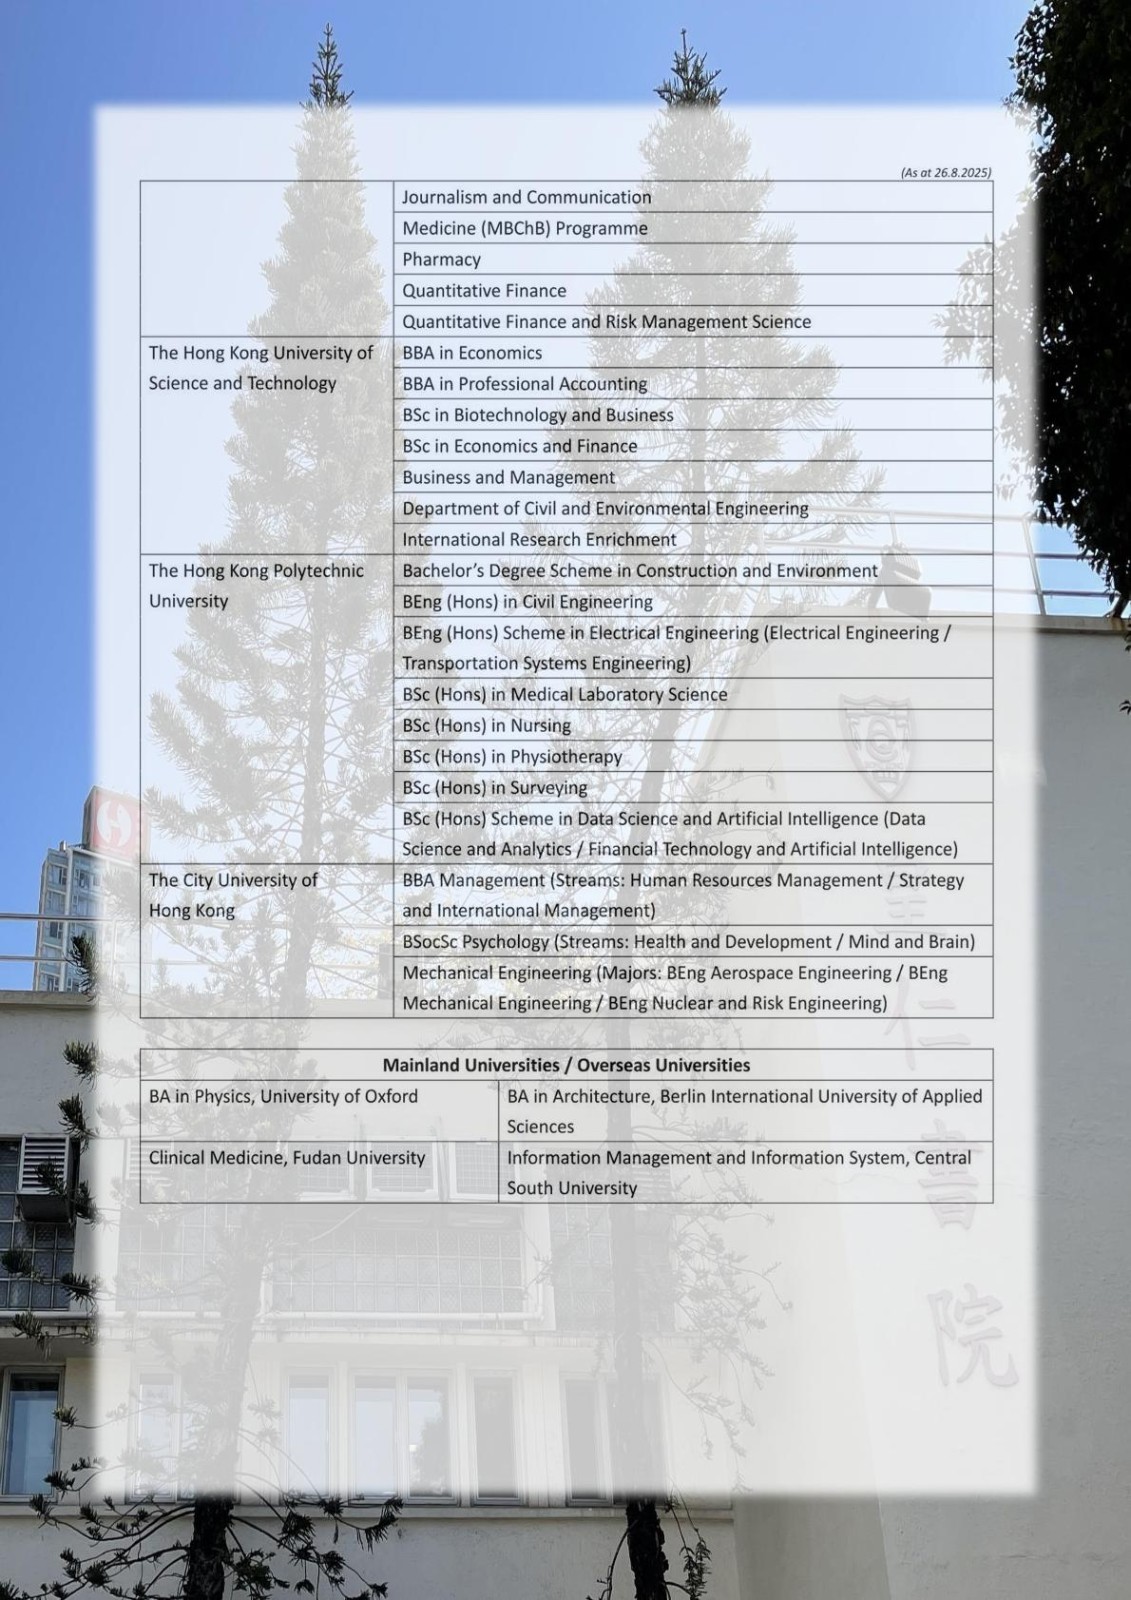
Detailed University Placement Results
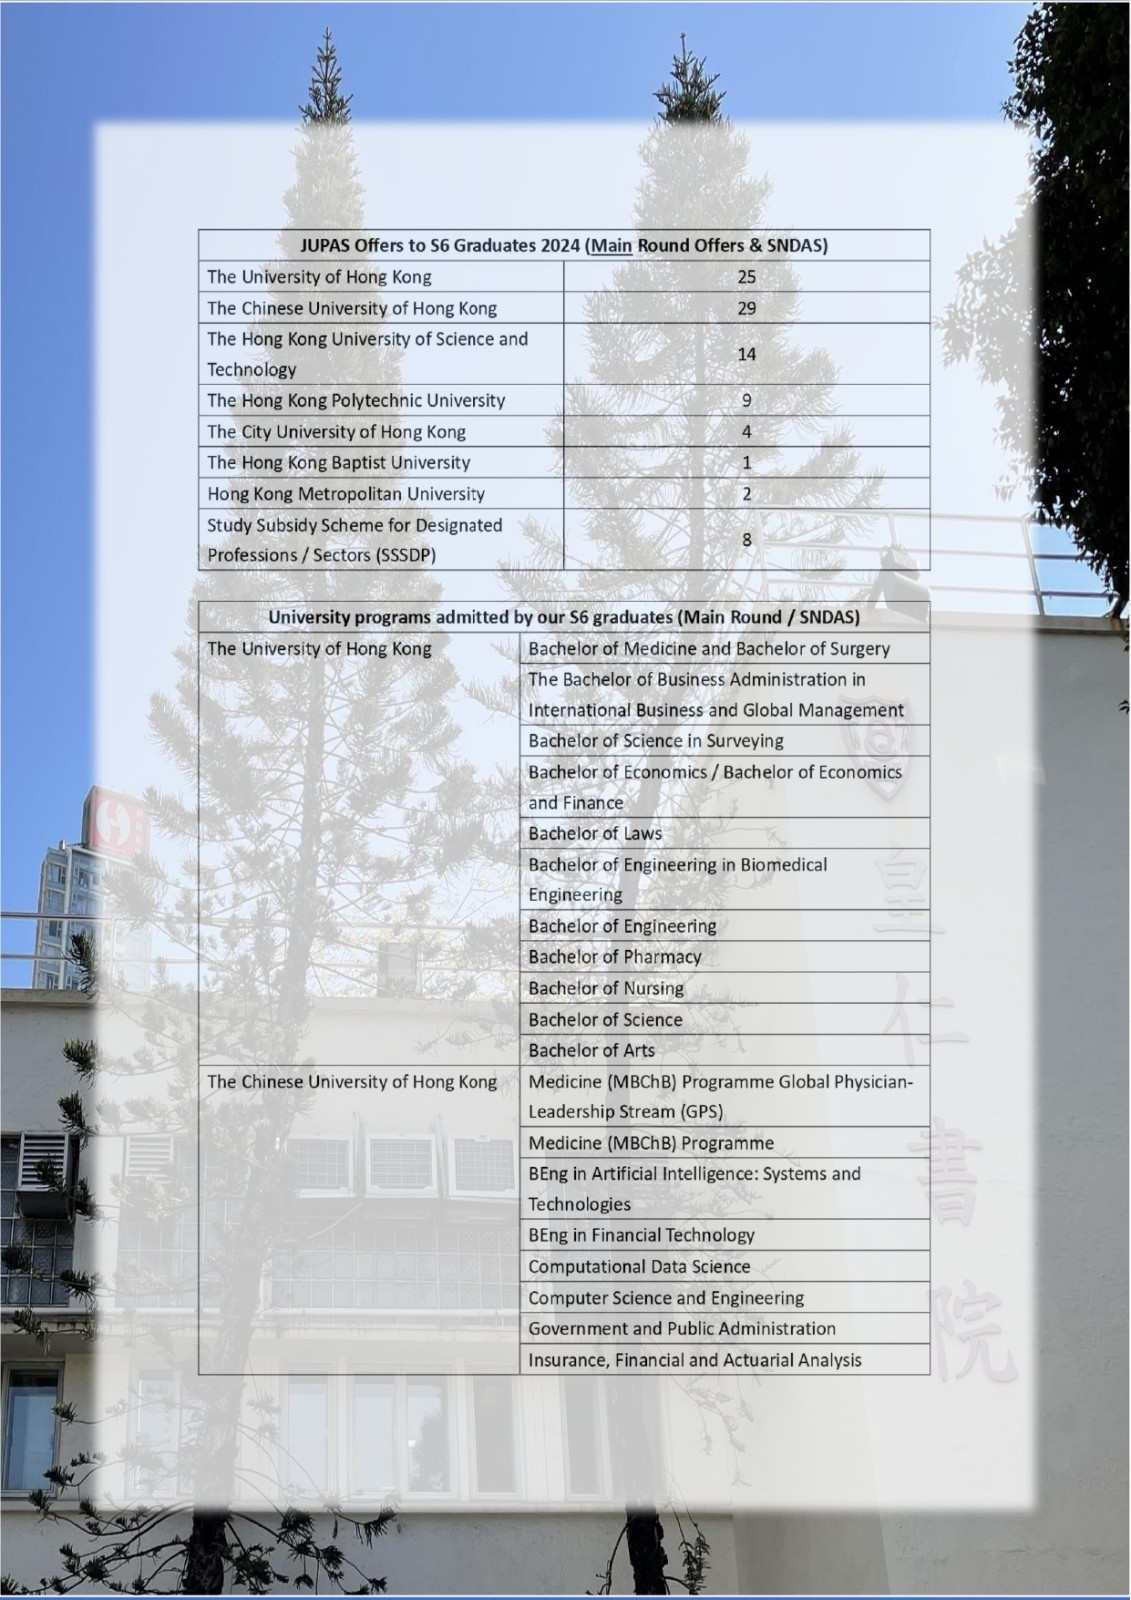
| University Name | 25 Matriculations25 Matric. | 25 Matric. %25 % | 24 Matriculations24 Matric. | 24 Matric. %24 % | QS | US | THE | Country |
|---|---|---|---|---|---|---|---|---|
The University of Hong Kong | 36 | 37.9% | 25 | 27.2% | 11 | - | - | 中国Hong Kong |
The Chinese University of Hong Kong | 21 | 22.1% | 29 | 31.5% | 32 | - | 43 | 中国Hong Kong |
The Hong Kong University of Science and Technology | 12 | 12.6% | 14 | 15.2% | 44 | - | 60 | 中国Hong Kong |
The Hong Kong Polytechnic University | 10 | 10.5% | 9 | 9.8% | 54 | - | 80 | 中国Hong Kong |
The Education University of Hong Kong | 5 | 5.3% | 4 | 4.3% | - | - | - | 中国Hong Kong |
Hong Kong Baptist University | 2 | 2.1% | 1 | 1.1% | - | - | - | 中国Hong Kong |
Lingnan University, Hong Kong | 1 | 1.1% | - | - | - | - | - | 中国Hong Kong |
Hong Kong Metropolitan University | 3 | 3.2% | 2 | 2.2% | - | - | - | 中国Hong Kong |
SSSDP | 5 | 5.3% | 8 | 8.7% | - | - | - |
Data Notes
Matriculation counts students who finally enroll at a university. Since each student enrolls in only one university, total matriculations usually do not exceed total graduates.
Offer counts admission offers received by students. A student may receive multiple offers, so total offers are usually higher than total graduates.
| University Name | 25 Matriculations25 Matric. | 25 Matric. %25 % | 24 Matriculations24 Matric. | 24 Matric. %24 % | QS | US | THE |
|---|---|---|---|---|---|---|---|
The University of Hong Kong | 36 | 37.9% | 25 | 27.2% | 11 | - | - |
The Chinese University of Hong Kong | 21 | 22.1% | 29 | 31.5% | 32 | - | 43 |
The Hong Kong University of Science and Technology | 12 | 12.6% | 14 | 15.2% | 44 | - | 60 |
The Hong Kong Polytechnic University | 10 | 10.5% | 9 | 9.8% | 54 | - | 80 |
The Education University of Hong Kong | 5 | 5.3% | 4 | 4.3% | - | - | - |
Hong Kong Baptist University | 2 | 2.1% | 1 | 1.1% | - | - | - |
Lingnan University, Hong Kong | 1 | 1.1% | - | - | - | - | - |
Hong Kong Metropolitan University | 3 | 3.2% | 2 | 2.2% | - | - | - |
Sources
×
1 / 1
Living
Living & Commute Recommendations
| # | Estate | Best Commute | Commute Time | Distance | Overall Score |
|---|---|---|---|---|---|
| Loading... | |||||
Note: Monthly rent/total price are estimates based on government RVD monthly residential averages by area and size, for school-living decisions only.
-