
Ccc Ming Yin College
- CCCMYC
中华基督教会铭贤书院(英语:The Church of Christ in China Ming Yin College,简称:CCCMYC),是于1966年由中华基督教会创办的英文中学,位于香港九龙石硖尾港铁站上盖。现时铭贤书院的校训为“学以明道,荣神益人”(英语:Learn to perceive the Word of God, Glorify Him and do good to others),是深水埗区地区名校之一,排名(坊间传说)稳居该区前三位置;该校公开试成绩表现优异。在过去的十年中,公开试成绩有60%达到1A校级;40%是1B校级;师生称学校为MYCollege。是该区基层男生读资助类中学的首选。
Overview
Application Info
Useful Links
Contact
Map Location
Student Distribution
Student Enrollment Trend
| Grade | 2024-2025 | 2023-2024 | Δ Students | ||||
|---|---|---|---|---|---|---|---|
| Students | Classes | Students / Class | Students | Classes | Students / Class | ||
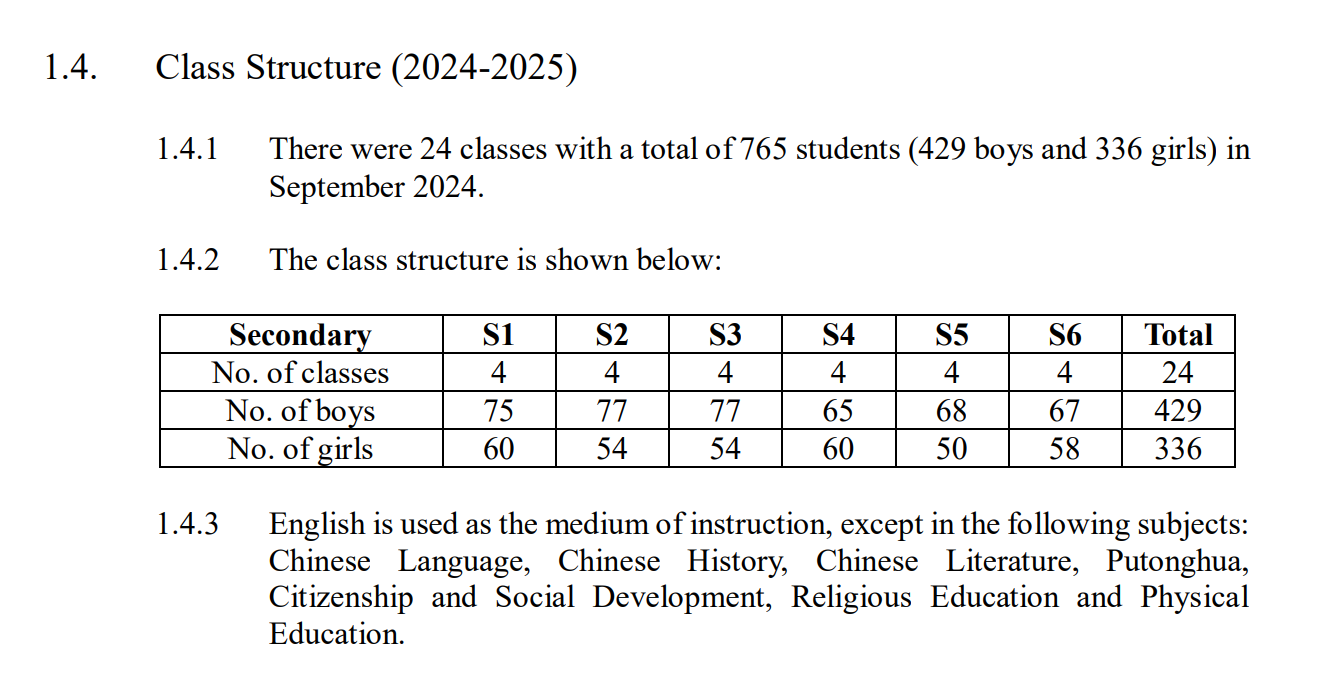
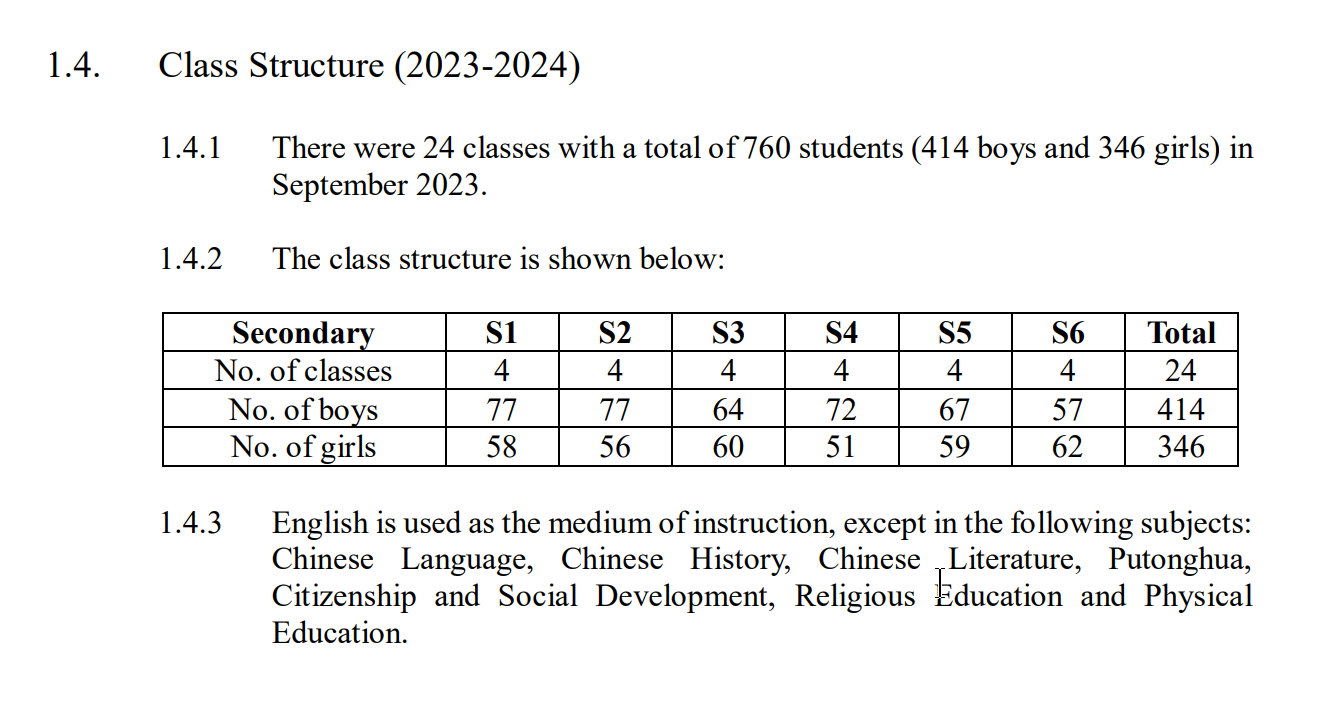
| S1 | 135 | 4 | 33.8 | 135 | 4 | 33.8 | - |
| S2 | 131 | 4 | 32.8 | 133 | 4 | 33.3 | ▼ 4 |
| S3 | 131 | 4 | 32.8 | 124 | 4 | 31 | ▼ 2 |
| S4 | 125 | 4 | 31.3 | 123 | 4 | 30.8 | ▲ 1 |
| S5 | 118 | 4 | 29.5 | 126 | 4 | 31.5 | ▼ 5 |
| S6 | 125 | 4 | 31.3 | 119 | 4 | 29.8 | ▼ 1 |
| Total | 765 | 24 | 31.9 | 760 | 24 | 31.7 | ▲ 5 |
Sources
Fees
Fee Information
| Grade | School Level | Age | Fees | Stage |
|---|---|---|---|---|
| G10 | S4 | 15 | $340 | 中四 |
| G11 | S5 | 16 | $340 | 中五 |
| G12 | S6 | 17 | $340 | 中六 |
Sources

Exam
DSE Overview
| Metrics | 2025 | 2024 | 2023 | Change |
|---|---|---|---|---|
| Key Metrics | ||||
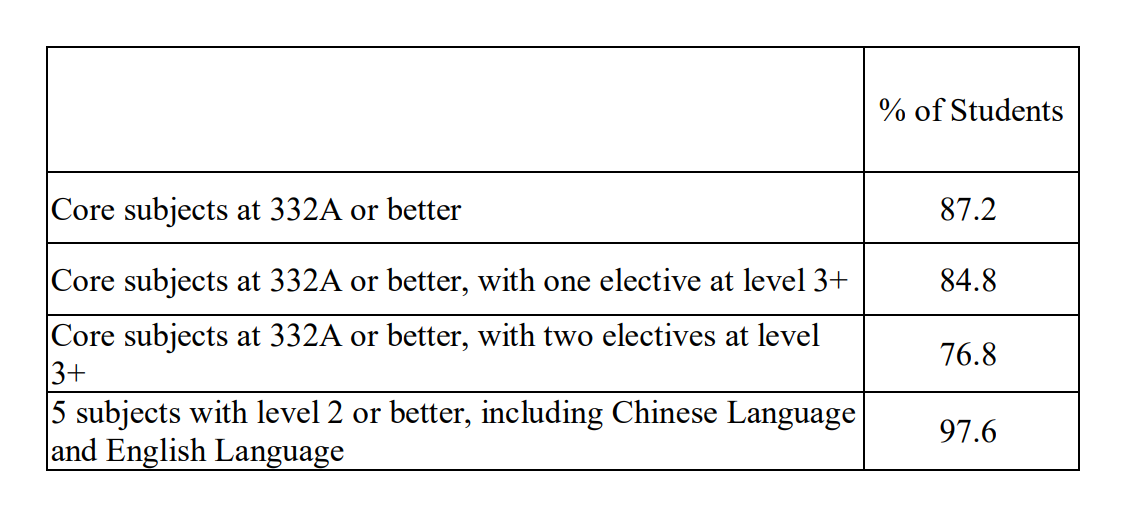
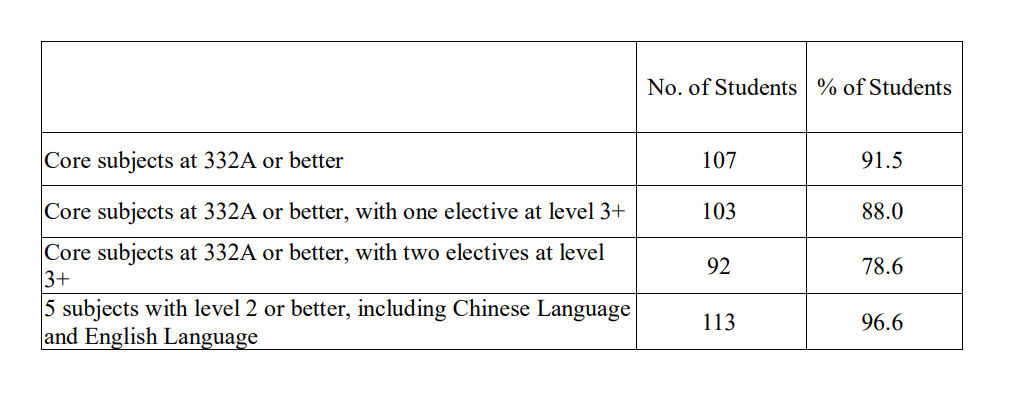
| 332A (Universities门槛) | 86.4% | 91.5% | 82.4% | ▼ 5.1% |
| 332A Notes | 332A | 332A | 33222 | - |
| 222A (副学士) | 97.6% | 96.6% | 93.6% | ▲ 1.0% |
| Level 5+ (优秀) | ||||
| Total 5+ | 26.6% | 28.3% | 23.9% | ▼ 1.7% |
| Level 4+ (良好) | ||||
| CEM 4+ (主科) | 64.2% | 65.2% | 58.0% | ▼ 1.0% |
| Chinese 4+ | 61.3% | 65.0% | 61.4% | ▼ 3.7% |
| English 4+ | 54.4% | 53.8% | 46.5% | ▲ 0.6% |
| 数学 4+ | 76.8% | 76.9% | 66.1% | ▼ 0.1% |
| Level 3+ (及格) | ||||
| CEM 3+ (主科) | - | 94.7% | - | - |
| Chinese 3+ | - | 88.9% | - | - |
| English 3+ | - | 98.1% | - | - |
| 数学 3+ | - | 97.0% | - | - |
| Level 2+ (基础) | ||||
| CEM 2+ (主科) | 99.5% | 100.0% | 97.9% | ▼ 0.5% |
| Chinese 2+ | 99.2% | 100.0% | 97.6% | ▼ 0.8% |
| English 2+ | 100.0% | 100.0% | 99.2% | - |
| 数学 2+ | 99.2% | 100.0% | 96.9% | ▼ 0.8% |
| 人数 | ||||
| DSE Candidates | 125 | 117 | 127 | ▲ 8 |
DSE Subject Results
| Subject | 2025 (%) | 2024 (%) | Change |
|---|---|---|---|
| Chinese | 61.3 | 65.0 | ▼ 3.7 |
| Chinese History | 45.8 | 64.3 | ▼ 18.5 |
| Chinese Literature | 33.3 | 56.3 | ▼ 23.0 |
| English | 54.4 | 53.8 | ▲ 0.6 |
| Compulsory Mathematics | 76.8 | 76.9 | ▼ 0.1 |
| Mathematics M1 | 81.8 | 75.0 | ▲ 6.8 |
| Mathematics M2 | 69.2 | 78.6 | ▼ 9.4 |
| Physics | 88.0 | 67.9 | ▲ 20.1 |
| Biology | 84.6 | 79.2 | ▲ 5.4 |
| BAFS Accounting | 81.0 | 85.2 | ▼ 4.2 |
| ICT | 55.6 | 60.0 | ▼ 4.4 |
| Chemistry | 48.8 | 83.0 | ▼ 34.2 |
| Economics | 47.6 | 59.6 | ▼ 12.0 |
| History | 47.4 | 57.9 | ▼ 10.5 |
| Geography | 43.5 | 22.2 | ▲ 21.3 |
| Visual Arts | 16.7 | 33.3 | ▼ 16.6 |
| Chinese | 99.2 | 100.0 | ▼ 0.8 |
| Chinese History | 100.0 | 100.0 | - |
| Chinese Literature | 90.5 | 100.0 | ▼ 9.5 |
| English | 100.0 | 100.0 | - |
| Compulsory Mathematics | 99.2 | 100.0 | ▼ 0.8 |
| Mathematics M1 | 100.0 | 100.0 | - |
| Mathematics M2 | 100.0 | 100.0 | - |
| BAFS Accounting | 100.0 | 100.0 | - |
| History | 100.0 | 100.0 | - |
| ICT | 100.0 | 93.3 | ▲ 6.7 |
| Physics | 100.0 | 100.0 | - |
| Visual Arts | 100.0 | 100.0 | - |
| Biology | 96.2 | 97.9 | ▼ 1.7 |
| Geography | 95.7 | 94.4 | ▲ 1.3 |
| Economics | 95.2 | 94.2 | ▲ 1.0 |
| Chemistry | 90.7 | 100.0 | ▼ 9.3 |
Sources
Placement
University Placement Analysis
| Placement Destinations | 2025Year | 2024Year | Change |
|---|---|---|---|
| JUPAS Rate | 77.6% | 94.0% | ▼ 16.4% |
| Bachelor and Associate Degree Rate | 77.6% | 94.0% | ▼ 16.4% |
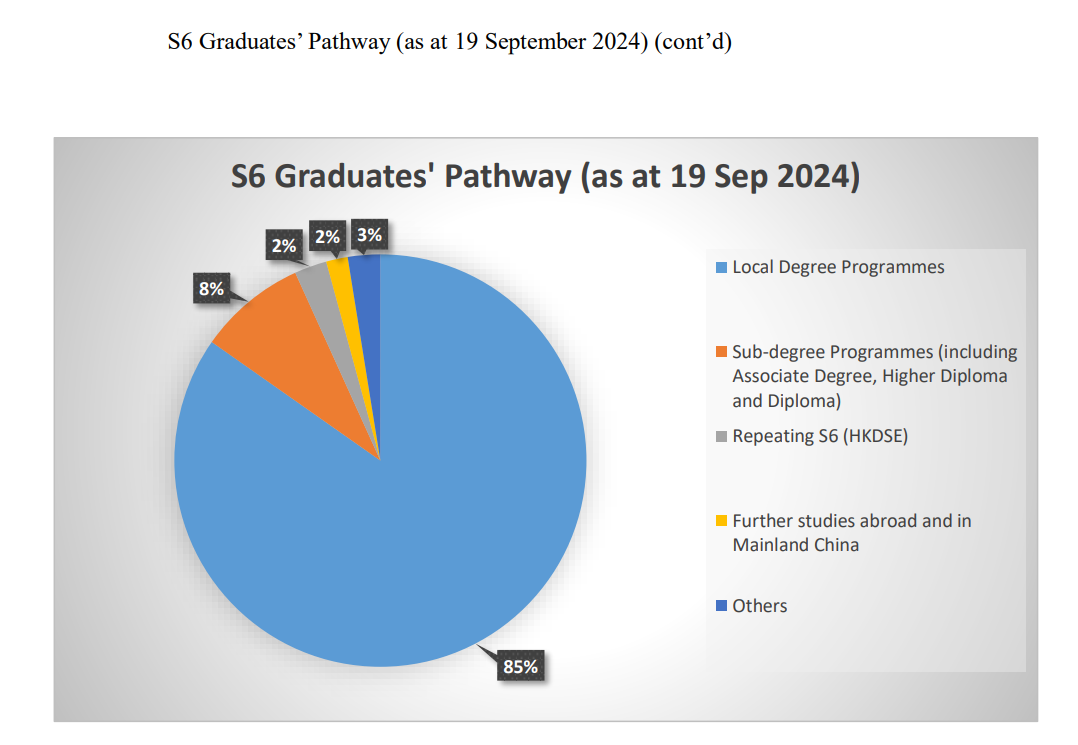
| 总本科率(本地+Overseas) | 77.6% | 85.5% | ▼ 7.9% |
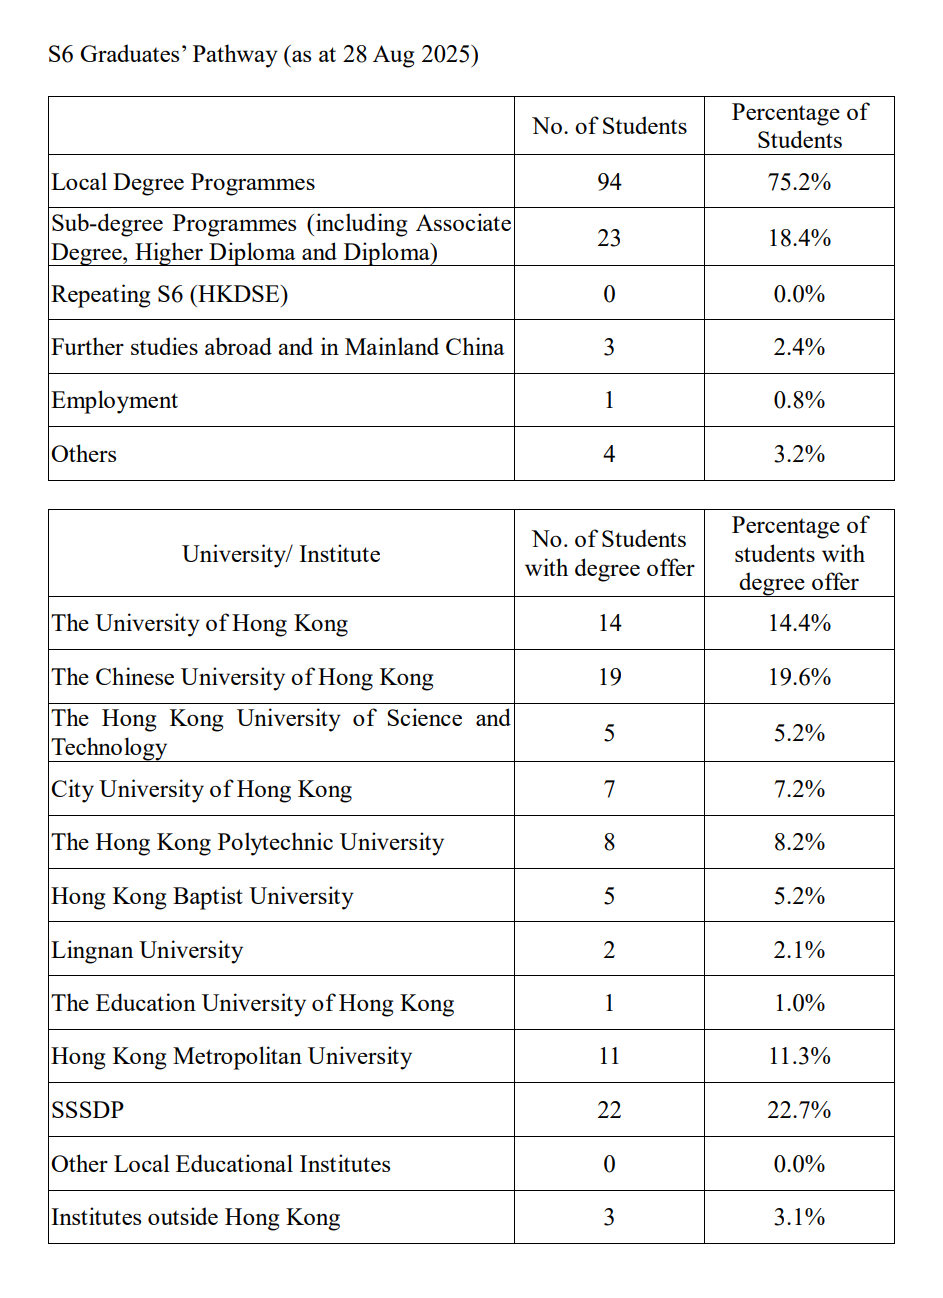
| Hong Kong本地本科率 | 75.2% | 85.5% | ▼ 10.3% |
| 副学士学位率 | 18.4% | - | |
| Overseas本科率 | 2.4% | - | |
| SSSDP Rate | - | 13.7% | - |
| Progression Rate | 96.0% | 94.0% | ▲ 2.0% |
| Repeat Year Rate | 0.0% | 2.6% | ▼ 2.6% |
2025 University Tier Analysis
| University Tier | 2025Enrollment25Enrollment | 2025Enrollment%25% | 2025EnrollmentCumulative%25Cumulative | 2024Enrollment24Enrollment | 2024Enrollment%24% | 2024EnrollmentCumulative%24Cumulative | ΔOffers%Δ% |
|---|---|---|---|---|---|---|---|
| Total Students | 125 | 100.0% | - | 117 | 100.0% | - | - |
| HK Top 3 | 38 | 30.4% | 30.4% | 34 | 29.1% | 29.1% | +1.3% |
| HK Top 4 | 8 | 6.4% | 36.8% | 17 | 14.5% | 43.6% | -8.1% |
| HK Top 5 | 7 | 5.6% | 42.4% | 9 | 7.7% | 51.3% | -2.1% |
Detailed University Placement Results
| University Name | 25 Matriculations25 Matric. | 25 Matric. %25 % | 24 Matriculations24 Matric. | 24 Matric. %24 % | QS | US | THE | Country |
|---|---|---|---|---|---|---|---|---|
The University of Hong Kong | 14 | 14.4% | 13 | 12.7% | 11 | - | - | 中国Hong Kong |
The Chinese University of Hong Kong | 19 | 19.6% | 13 | 12.7% | 32 | - | 43 | 中国Hong Kong |
The Hong Kong University of Science and Technology | 5 | 5.2% | 8 | 7.8% | 44 | - | 60 | 中国Hong Kong |
The Hong Kong Polytechnic University | 8 | 8.2% | 17 | 16.7% | 54 | - | 80 | 中国Hong Kong |
City University of Hong Kong | 7 | 7.2% | 9 | 8.8% | 63 | - | 73 | 中国Hong Kong |
Hong Kong Baptist University | 5 | 5.2% | 7 | 6.9% | - | - | - | 中国Hong Kong |
Lingnan University, Hong Kong | 2 | 2.1% | 8 | 7.8% | - | - | - | 中国Hong Kong |
The Education University of Hong Kong | 1 | 1.0% | 2 | 2.0% | - | - | - | 中国Hong Kong |
Hong Kong Metropolitan University | 11 | 11.3% | 8 | 7.8% | - | - | - | 中国Hong Kong |
SSSDP | 22 | 22.7% | 15 | 14.7% | - | - | - | |
Others/National Service | - | - | - | - | - | - | - | Other |
Overseas Universities | 3 | 3.1% | 2 | 2.0% | - | - | - |
Matriculation counts students who finally enroll at a university. Since each student enrolls in only one university, total matriculations usually do not exceed total graduates.
Offer counts admission offers received by students. A student may receive multiple offers, so total offers are usually higher than total graduates.
| University Name | 25 Matriculations25 Matric. | 25 Matric. %25 % | 24 Matriculations24 Matric. | 24 Matric. %24 % | QS | US | THE |
|---|---|---|---|---|---|---|---|
The University of Hong Kong | 14 | 14.4% | 13 | 12.7% | 11 | - | - |
The Chinese University of Hong Kong | 19 | 19.6% | 13 | 12.7% | 32 | - | 43 |
The Hong Kong University of Science and Technology | 5 | 5.2% | 8 | 7.8% | 44 | - | 60 |
The Hong Kong Polytechnic University | 8 | 8.2% | 17 | 16.7% | 54 | - | 80 |
City University of Hong Kong | 7 | 7.2% | 9 | 8.8% | 63 | - | 73 |
Hong Kong Baptist University | 5 | 5.2% | 7 | 6.9% | - | - | - |
Lingnan University, Hong Kong | 2 | 2.1% | 8 | 7.8% | - | - | - |
The Education University of Hong Kong | 1 | 1.0% | 2 | 2.0% | - | - | - |
Hong Kong Metropolitan University | 11 | 11.3% | 8 | 7.8% | - | - | - |
Sources
Living
Living & Commute Recommendations
| # | Estate | Best Commute | Commute Time | Distance | Overall Score |
|---|---|---|---|---|---|
| Loading... | |||||
Note: Monthly rent/total price are estimates based on government RVD monthly residential averages by area and size, for school-living decisions only.