
Po Leung Kuk Ngan Po Ling College
Po Leung Kuk Ngan Po Ling College
- NPL
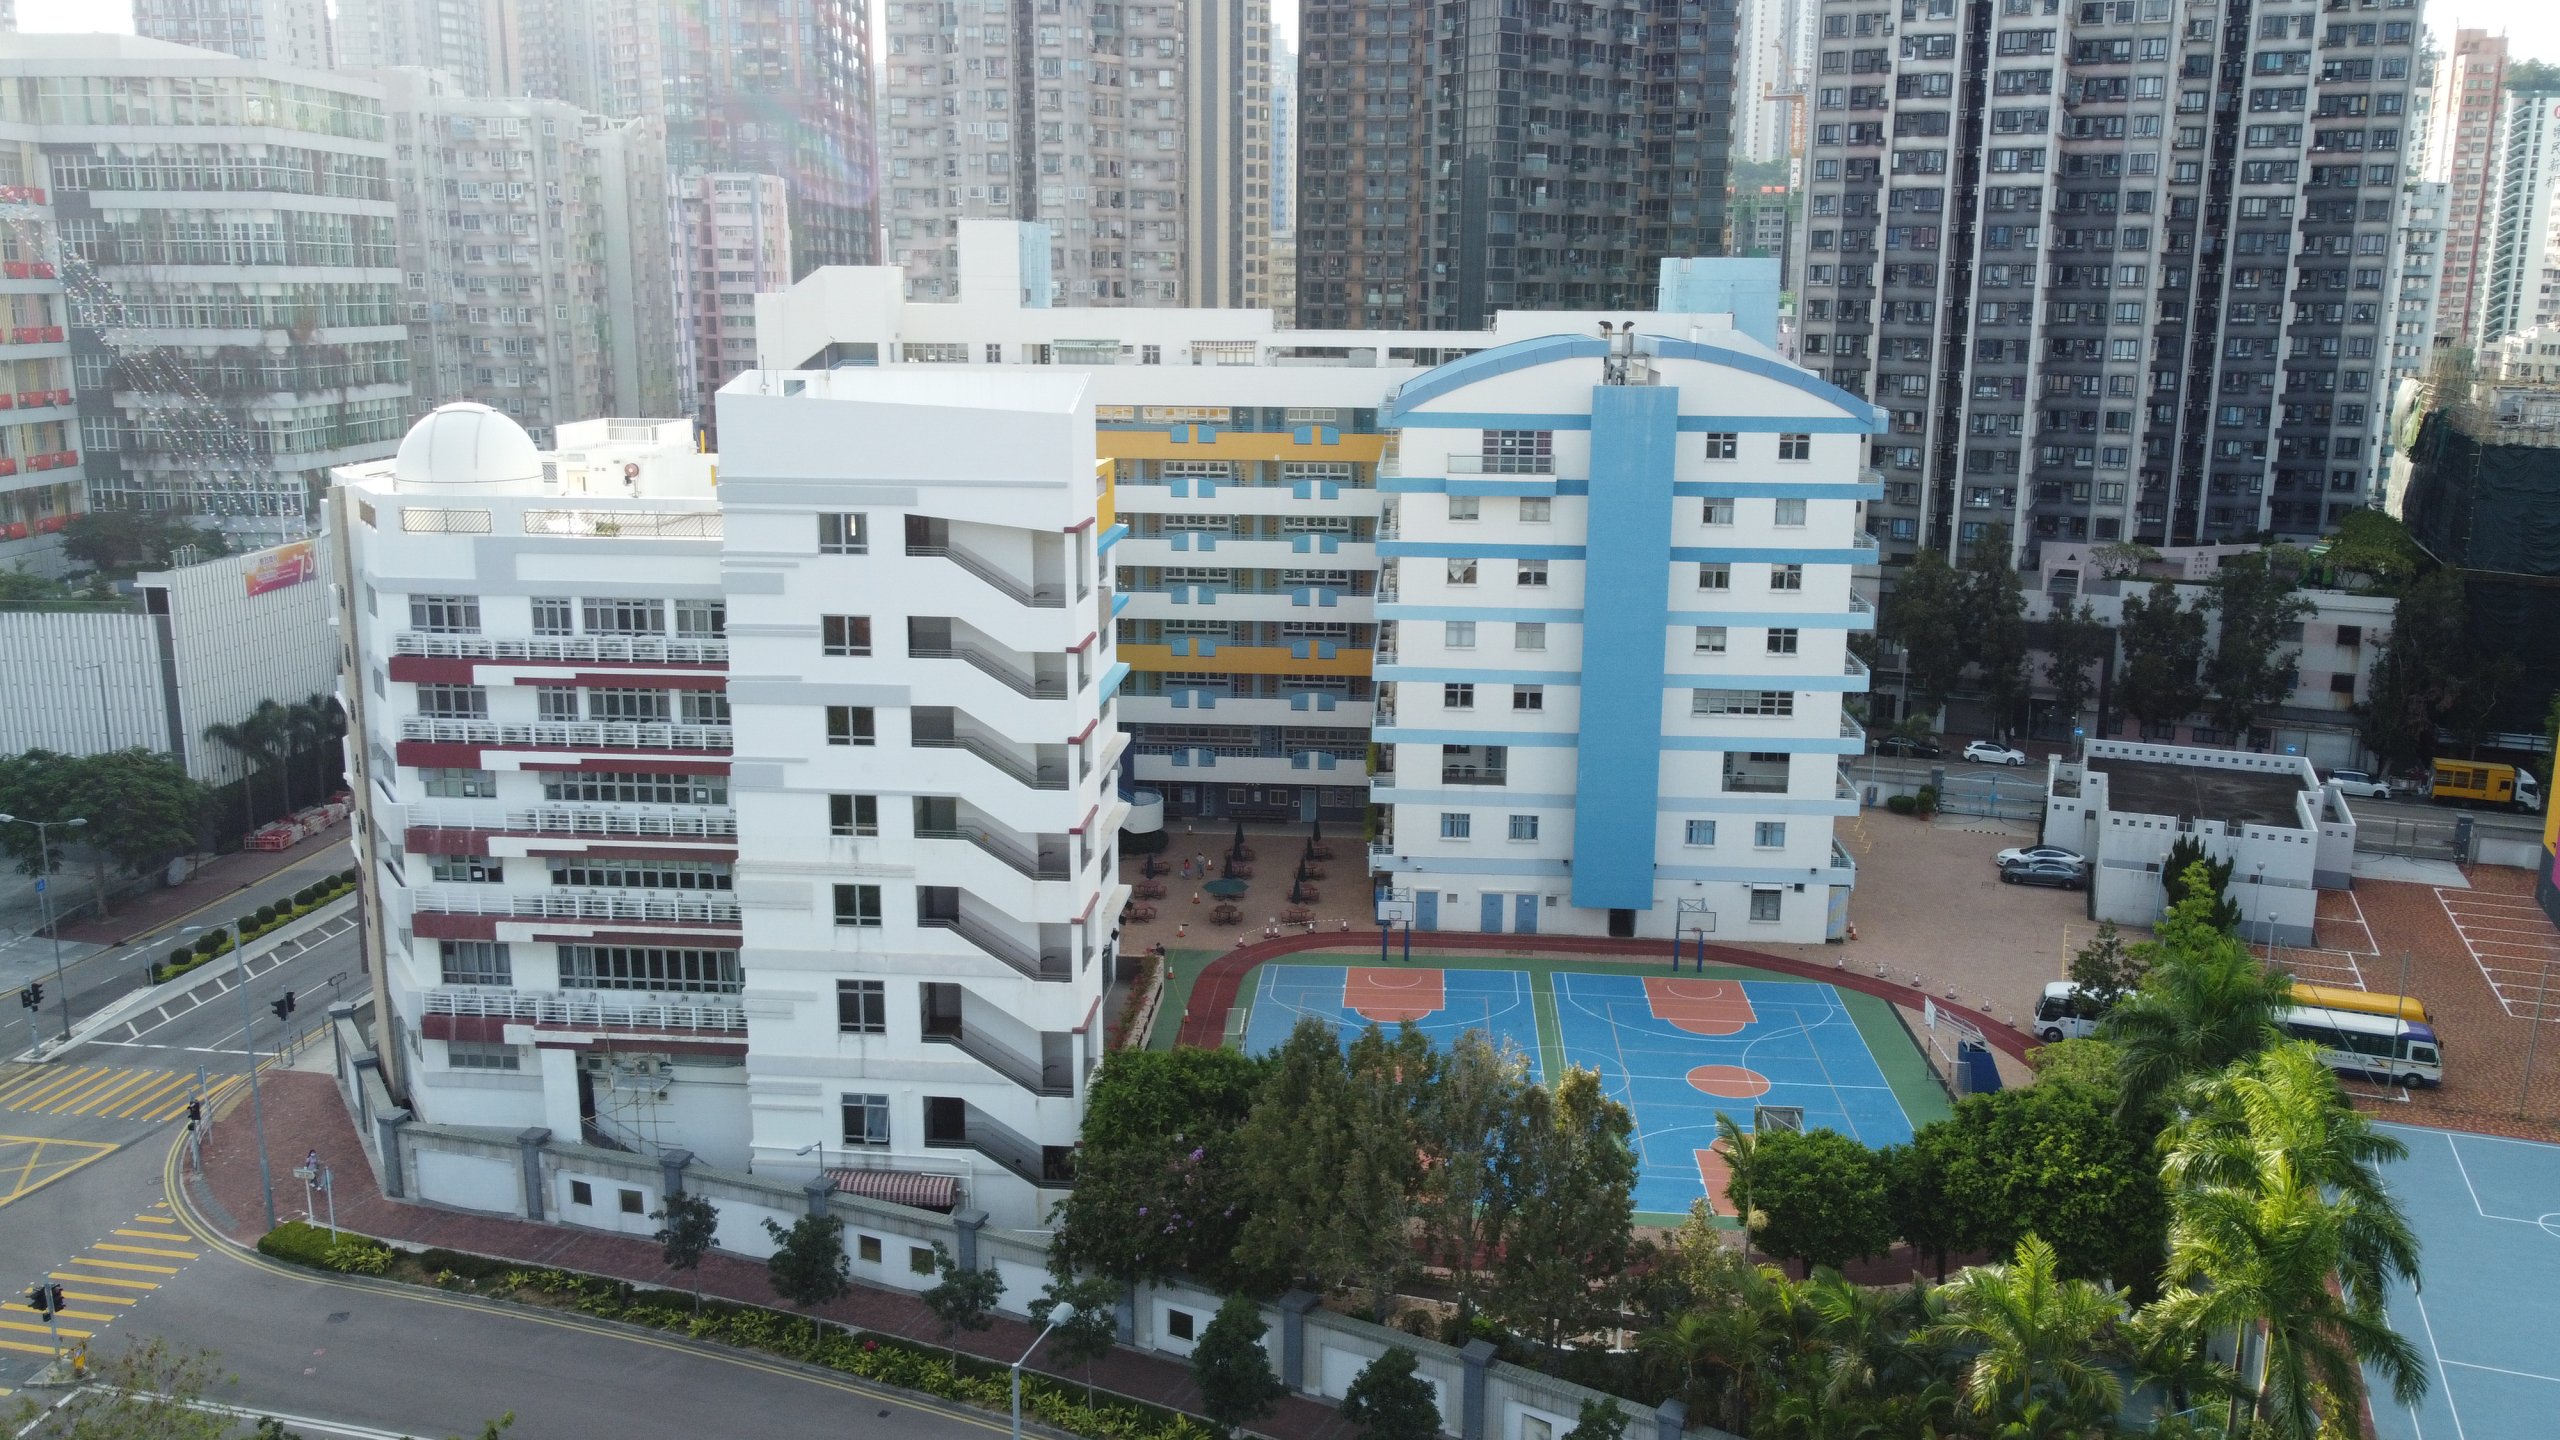
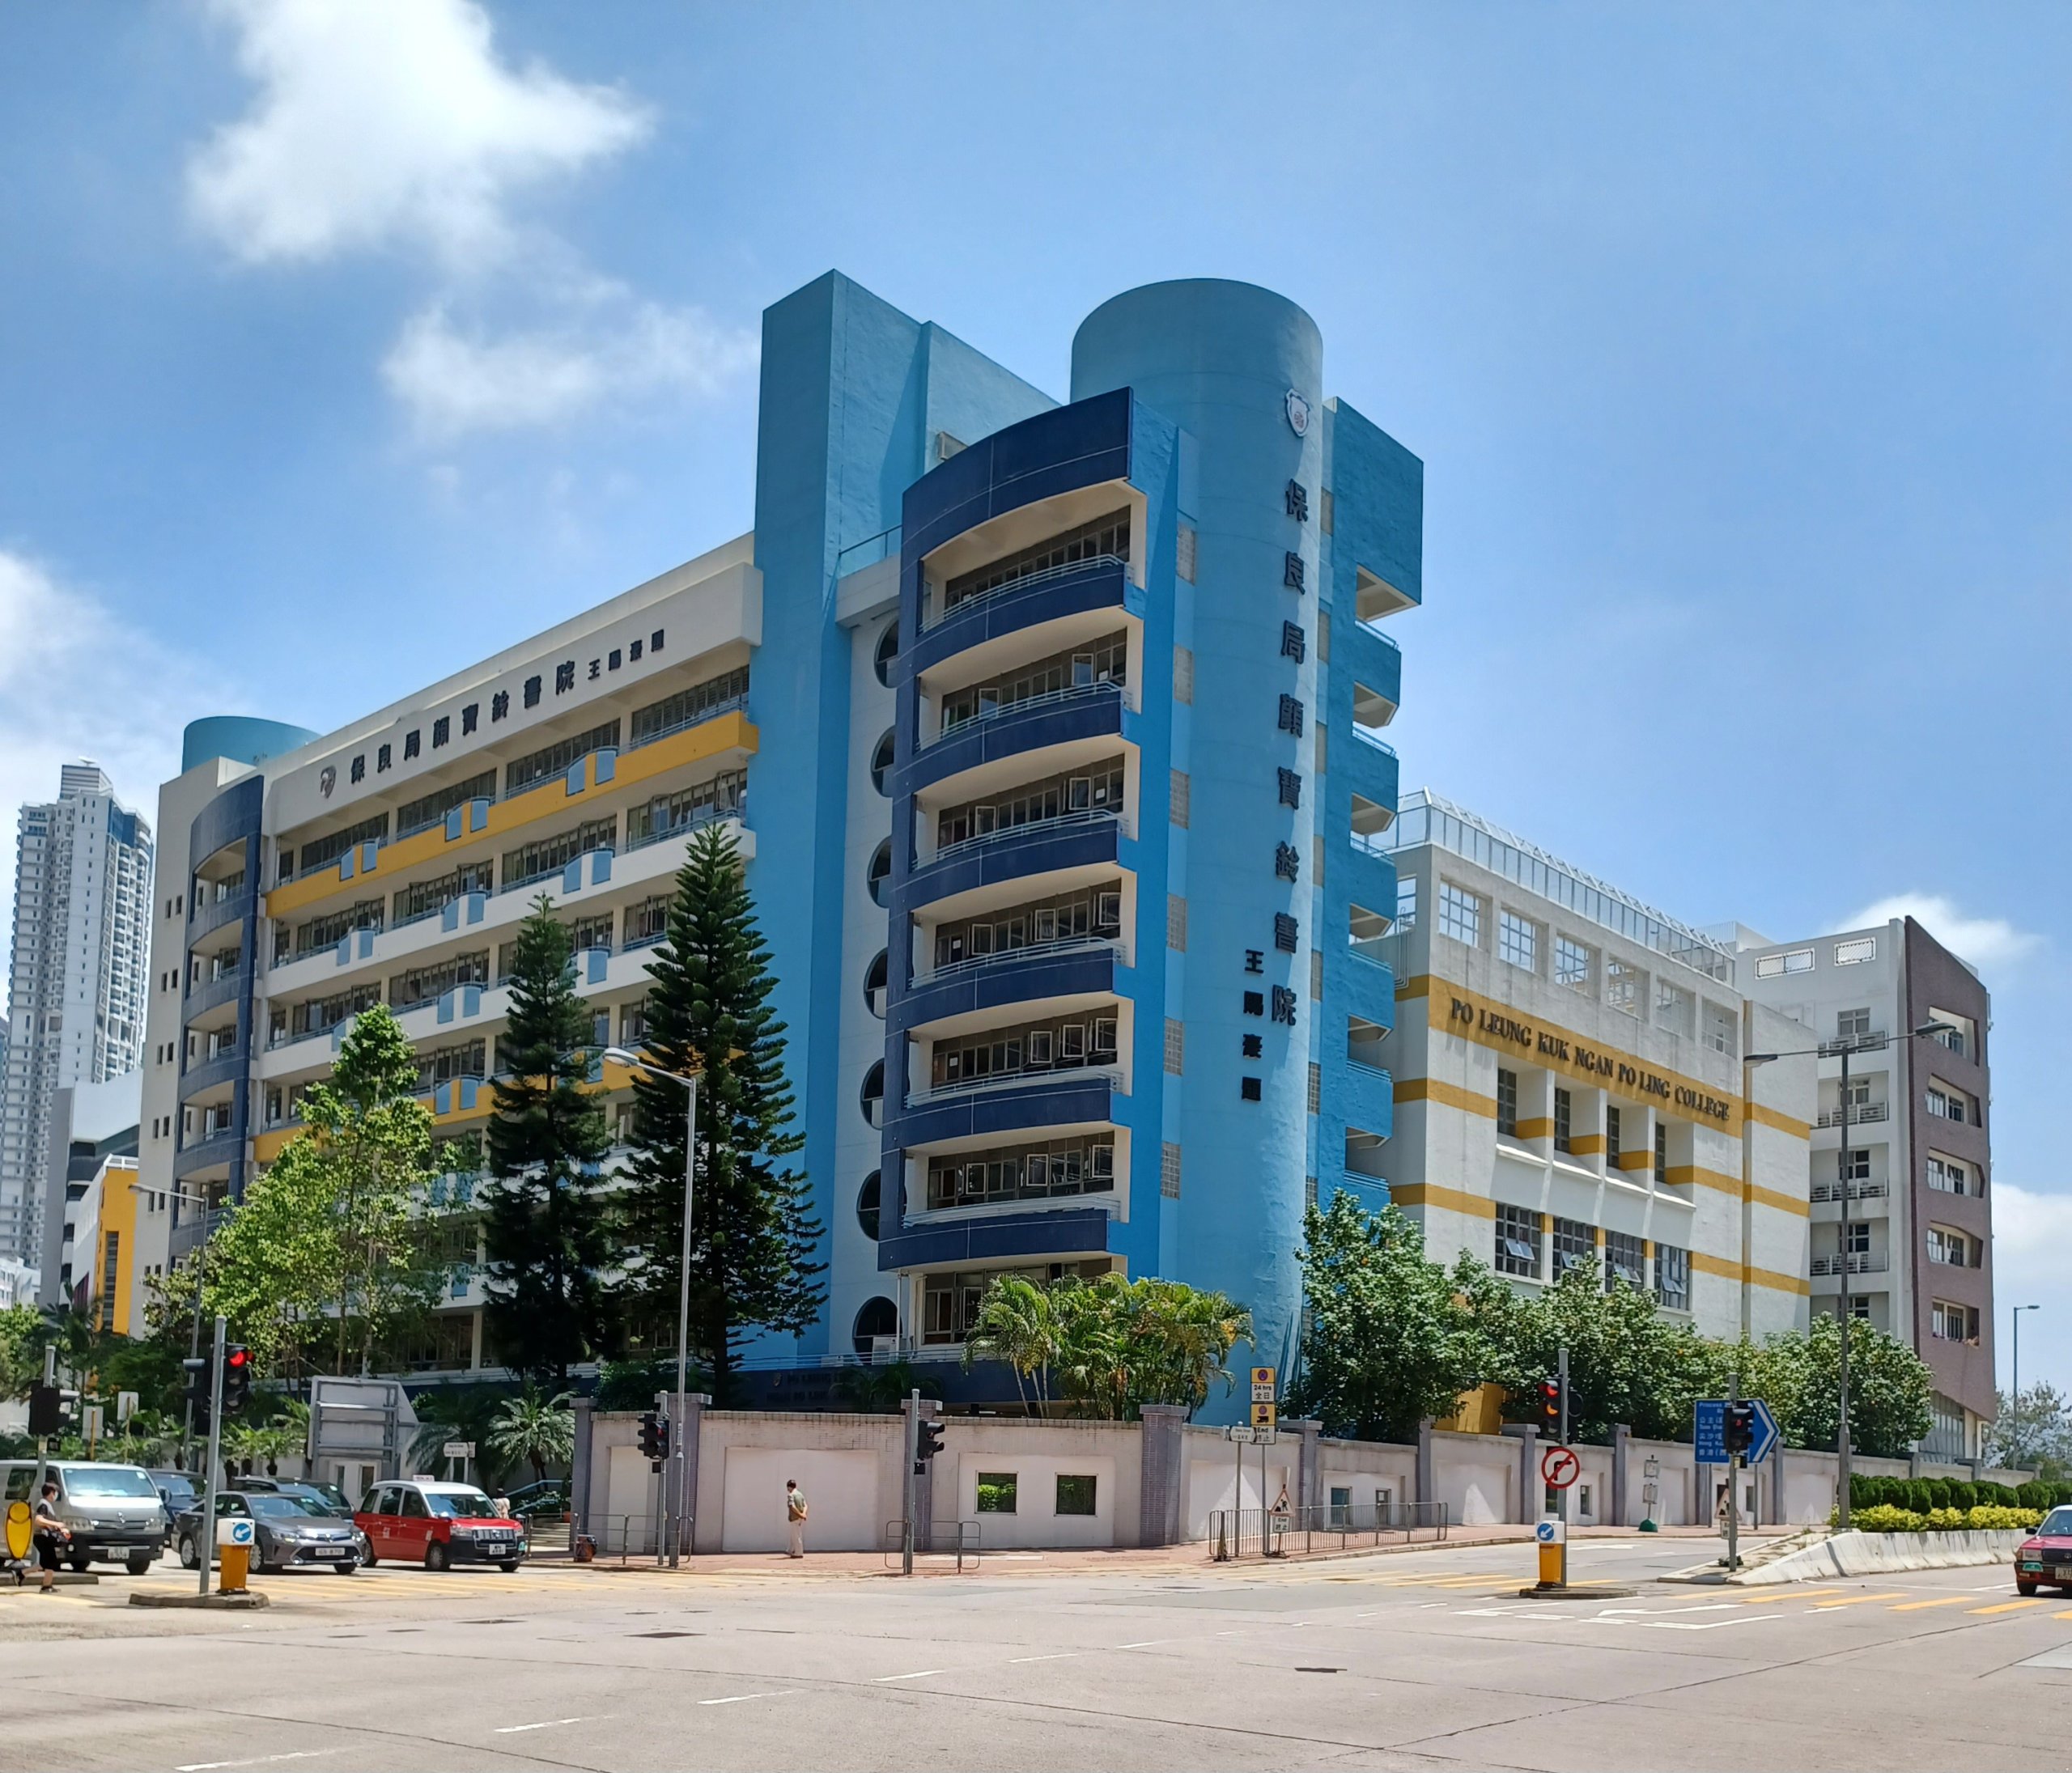
保良局颜宝铃书院(英语:Po Leung Kuk Ngan Po Ling College,简称PLKNPLC/NPL)是保良局教育机构辖下的第一所直资中学,成立于2003年。地址位于香港九龙土瓜湾崇安街,是一所全日制男女生的学校。每级5班,学生人数约744人。现时教职员共84人(包括6名外籍教师)。非华裔学生需修GCSE中文。于2014-2015学年率先在中四级开设IB预备课程,期后于2015-2016学年正式开设国际文凭大学预科课程(IBDP)。
保良局颜宝铃书院往年IB成绩在香港名列前十,DSE成绩则位居Band1A。
Overview
School Info
Band
Band 1b
School Gender
Co-ed
School Net
School Net Klc
Curriculum Type
ProfileType
Direct Subsidy Scheme
直升安排
N/A
Curriculum Features
Hong Kong本地→DSE+IBDP
Classes & Students
Age Group
12.31
Grade Setup
G7 - G12(S1 - S6)
Classes Count
5
Students / Class
平均28人/班
Total Students
831
Teaching Language
Teaching Language
English
Chinese Characters
Traditional Chinese
Religion
Religion
No Religion
Founded
2003
School Hours
8:00 am - 5:00 pm
费用情况
Annual Tuition
DSE: $35,200 IB: $96,500
Other
Boarding Service
提供寄宿
Entrance Exam
Chinese/English/Math Paper / English Interview / Cantonese Interview
Application Info
Minimum Application Grade
S2
Maximum Application Grade
S4
Eligible Application Grades
S2 / S3 / S4
Application Method
Online Application
Transfer Application Opens
2025/5/2
Transfer Application Deadline
2025/5/11
Useful Links
Contact
Phone
(852) 2462 3932 / 2462 3932
Email
info@home.npl.edu.hk
Address
Kowloon City区土瓜湾崇安街26号
Map Location
保良局顏寶鈴書院
Student Distribution
Student Enrollment Trend
Select Data Year:
| Grade | 2024-2025 | |
|---|---|---|
| Classes | Students / Class | |
| S1 | 5 | 0 |
| S2 | 5 | 0 |
| S3 | 5 | 0 |
| S4 | 5 | 0 |
| S5 | 5 | 0 |
| S6 | 5 | 0 |
| Total | 30 | 0 |
* Δ Students = students in this grade this year − students in the lower grade last year. It indicates cohort-size change.
Sources

2024-2025 Student Distribution
×
1 / 1
Fees
Fee Information
| Grade | School Level | Age | Fees | Stage |
|---|---|---|---|---|
| G7 | S1 | 12 | $35,200 | 中一 |
| G8 | S2 | 13 | $35,200 | 中二 |
| G9 | S3 | 14 | $35,200 | 中三 |
| G10 | S4 | 15 | $35,200 | 中四 |
| G11 | S5 | 16 | $35,200 | 中五 |
| G12 | S6 | 17 | $35,200 | 中六 |
Secondary S1 - S6$35,200
HKDSE
Secondary S1 - S3$111,516
非本地 Students HKDSE
Secondary S4 - S6$124,986
非本地 Students HKDSE
Secondary S5 - S6$96,500
本地 Students IBDP
Secondary S5 - S6$186,286
非本地 Students IBDP
Other Fees
Boarding FeeHK$76,000
Sources

×
1 / 1
Exam
IB Ranking
Rank 6 / 36
Higher Ranked
DSE Ranking
Rank 83 / 309
Higher Ranked
Lower Ranked
IB Overview
| Metrics | 2025 | 2024 | 2023 | Change |
|---|---|---|---|---|
| Key Metrics | ||||
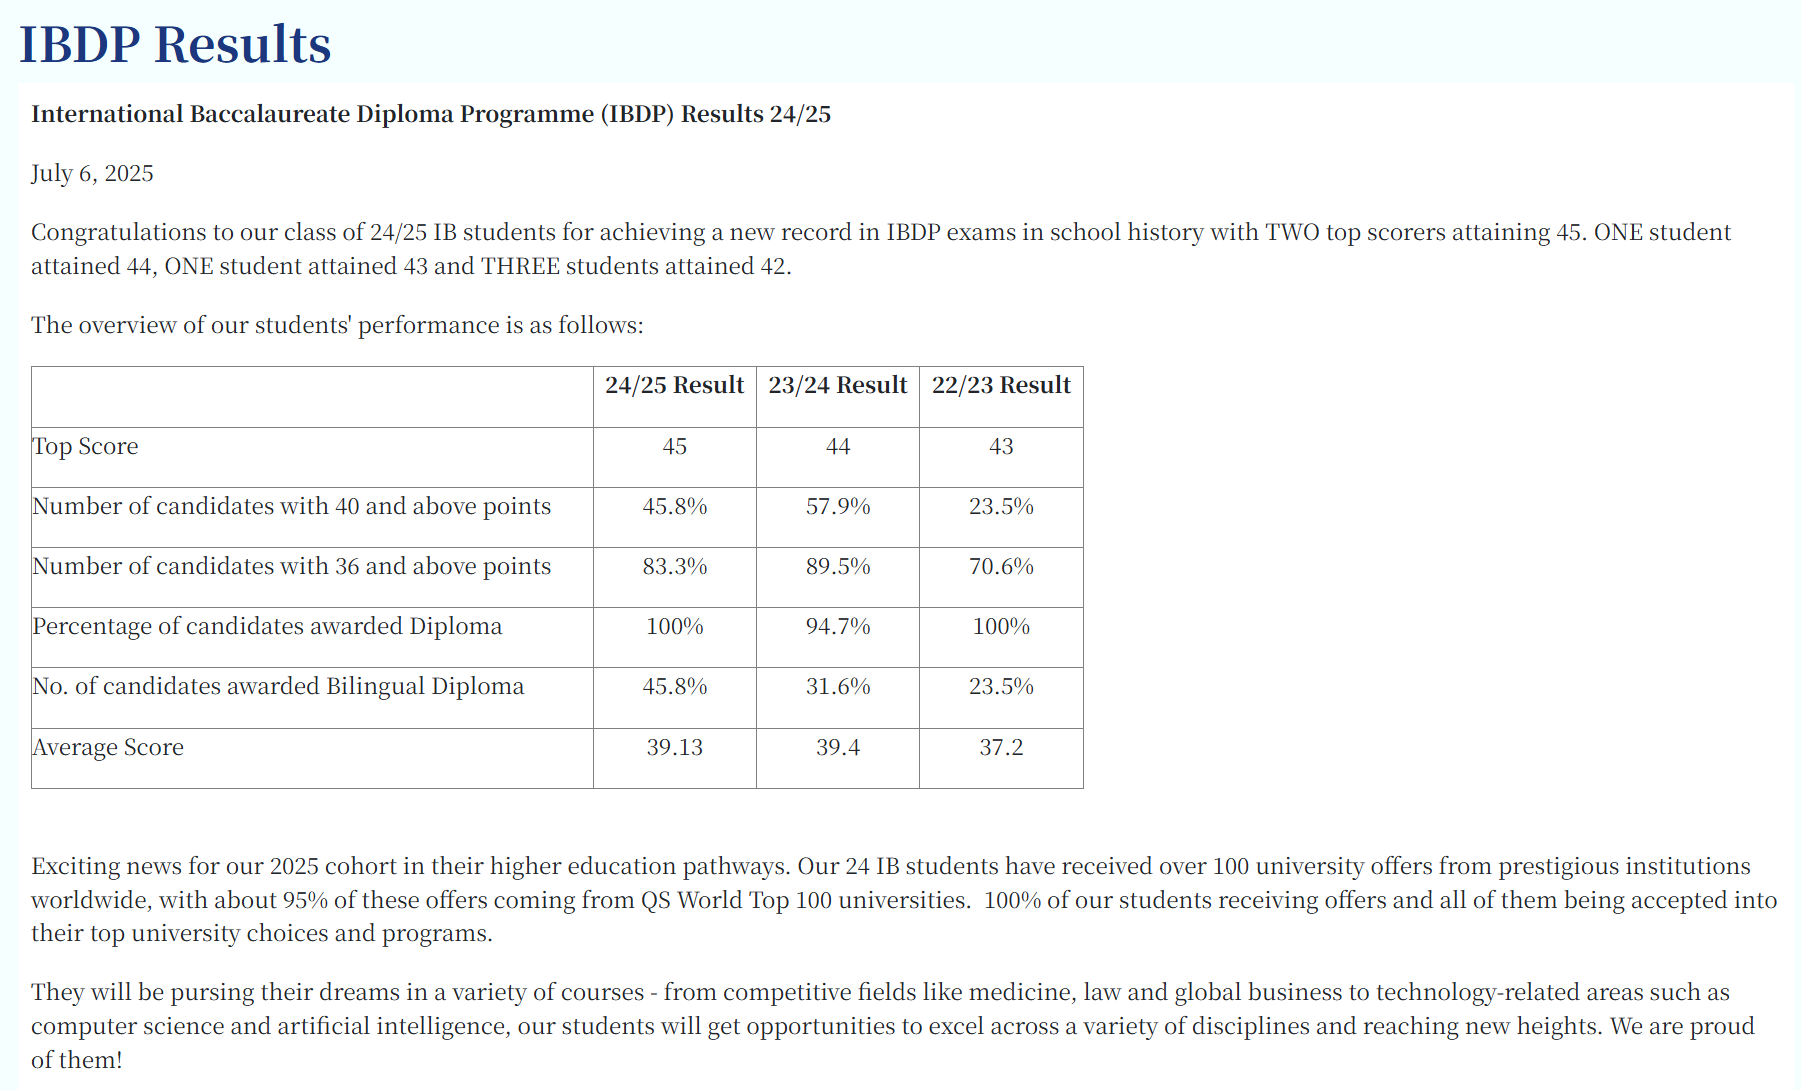
| Average Ranking Score | 39.1 | 39.4 | 37.2 | ▼ 0.3 |
| 合格人数 (合格率) | 24 | 100.0% | 18 | 94.7% | 17 | 100.0% | ▲ 6.0 |
| 双语文凭人数 (双语文凭率) | 11 | 45.8% | 6 | 31.6% | 4 | 23.5% | ▲ 5.0 |
| 人数指标 | ||||
| IB Candidates (IB人数比例) | 24 | 19 | 23.5% | 17 | 16.8% | ▲ 5.0 |
| 非 IB Candidates (非IB人数比例) | - | 62 | 76.5% | 84 | 83.2% | - |
| Total Students | - | 81 | 101 | - |
| 高分段人数分布 | ||||
| IB 45分人数 (IB45分%) | 2 | 8.3% | - | - | - |
| IB 44分人数 (IB44分%) | 1 | 4.2% | 4 | 21.1% | - | ▼ 3.0 |
| IB 43分人数 (IB43分%) | 1 | 4.2% | 00.0% | 1 | 5.9% | ▲ 1.0 |
| IB 42分人数 (IB42分%) | 3 | 12.5% | 3 | 15.8% | - | - |
| 各分数段Cumulative人数 | ||||
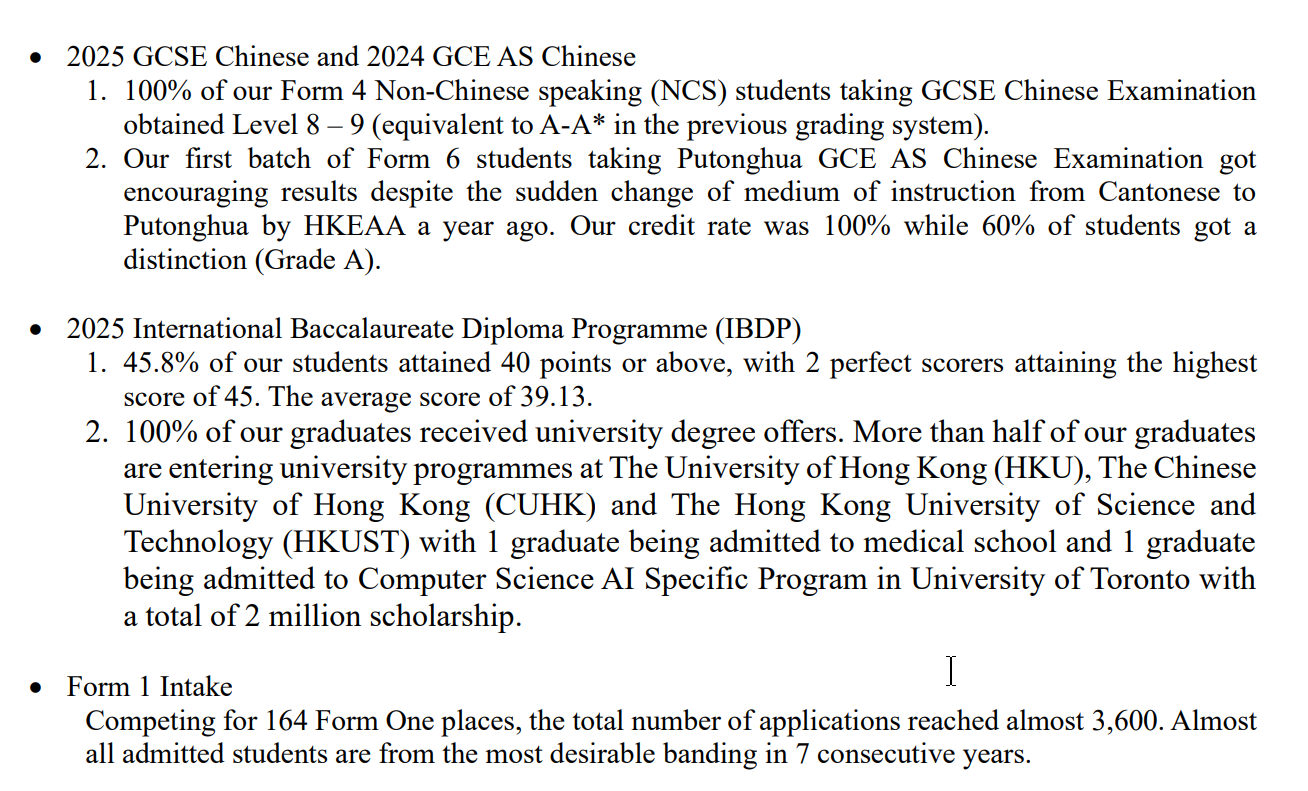
| IB 40+人数 (IB40+%) | 11 | 45.8% | 11 | 57.9% | 4 | 23.5% | - |
| IB 36+人数 (IB36+%) | 20 | 83.3% | 17 | 89.5% | 12 | 70.6% | ▲ 3.0 |
DSE Overview
| Metrics | 2025 | 2024 | 2023 | Change |
|---|---|---|---|---|
| Key Metrics | ||||
| 332A (Universities门槛) | - | 85.4% | 82.7% | - |
| 222A (副学士) | - | 98.8% | 98.8% | - |
| Level 5+ (优秀) | ||||
| CEM 5+ (主科) | 29.5% | 26.0% | - | ▲ 3.5% |
| English 5+ | 31.0% | 26.0% | - | ▲ 5.0% |
| 数学 5+ | 28.0% | 26.0% | - | ▲ 2.0% |
| Level 4+ (良好) | ||||
| CEM 4+ (主科) | 64.9% | 62.2% | 62.8% | ▲ 2.7% |
| Chinese 4+ | 50.5% | 38.0% | 36.0% | ▲ 12.5% |
| English 4+ | 74.1% | 80.5% | 86.4% | ▼ 6.4% |
| 数学 4+ | 70.0% | 68.0% | 66.0% | ▲ 2.0% |
| 人数 | ||||
| DSE Candidates | - | 122 | 84 | - |
| Non-DSE Candidates | - | 19 | 17 | - |
Sources
×
1 / 1
Placement
University Placement Analysis
| Placement Destinations | 2025Year | 2024Year | Change |
|---|---|---|---|
| Hong KongTop 3 Rate | 40.9% | 50.9% | ▼ 10.0% |
| JUPAS Rate | 81.0% | 90.0% | ▼ 9.0% |
| Bachelor and Associate Degree Rate | - | 50.9% | - |
| Hong Kong本地本科率 | - | 50.9% | - |
| SSSDP Rate | - | 14.0% | - |
| Progression Rate | - | 50.9% | - |
2025 University Tier Analysis
| University Tier | 2025Enrollment25Enrollment | 2025Enrollment%25% | 2025EnrollmentCumulative%25Cumulative | 2024Enrollment24Enrollment | 2024Enrollment%24% | 2024EnrollmentCumulative%24Cumulative | ΔOffers%Δ% |
|---|---|---|---|---|---|---|---|
| Total Students | 81 | 100.0% | - | 80 | 100.0% | - | - |
| HK Top 3 | 27 | 33.3% | 33.3% | 26 | 32.5% | 32.5% | +0.8% |
| HK Top 4 | 6 | 7.4% | 40.7% | 5 | 6.3% | 38.8% | +1.2% |
| HK Top 5 | 4 | 4.9% | 45.7% | 11 | 13.8% | 52.5% | -8.8% |
Detailed University Placement Results
| University Name | 25 Matriculations25 Matric. | 25 Matric. %25 % | 24 Matriculations24 Matric. | 24 Matric. %24 % | QS | US | THE | Country |
|---|---|---|---|---|---|---|---|---|
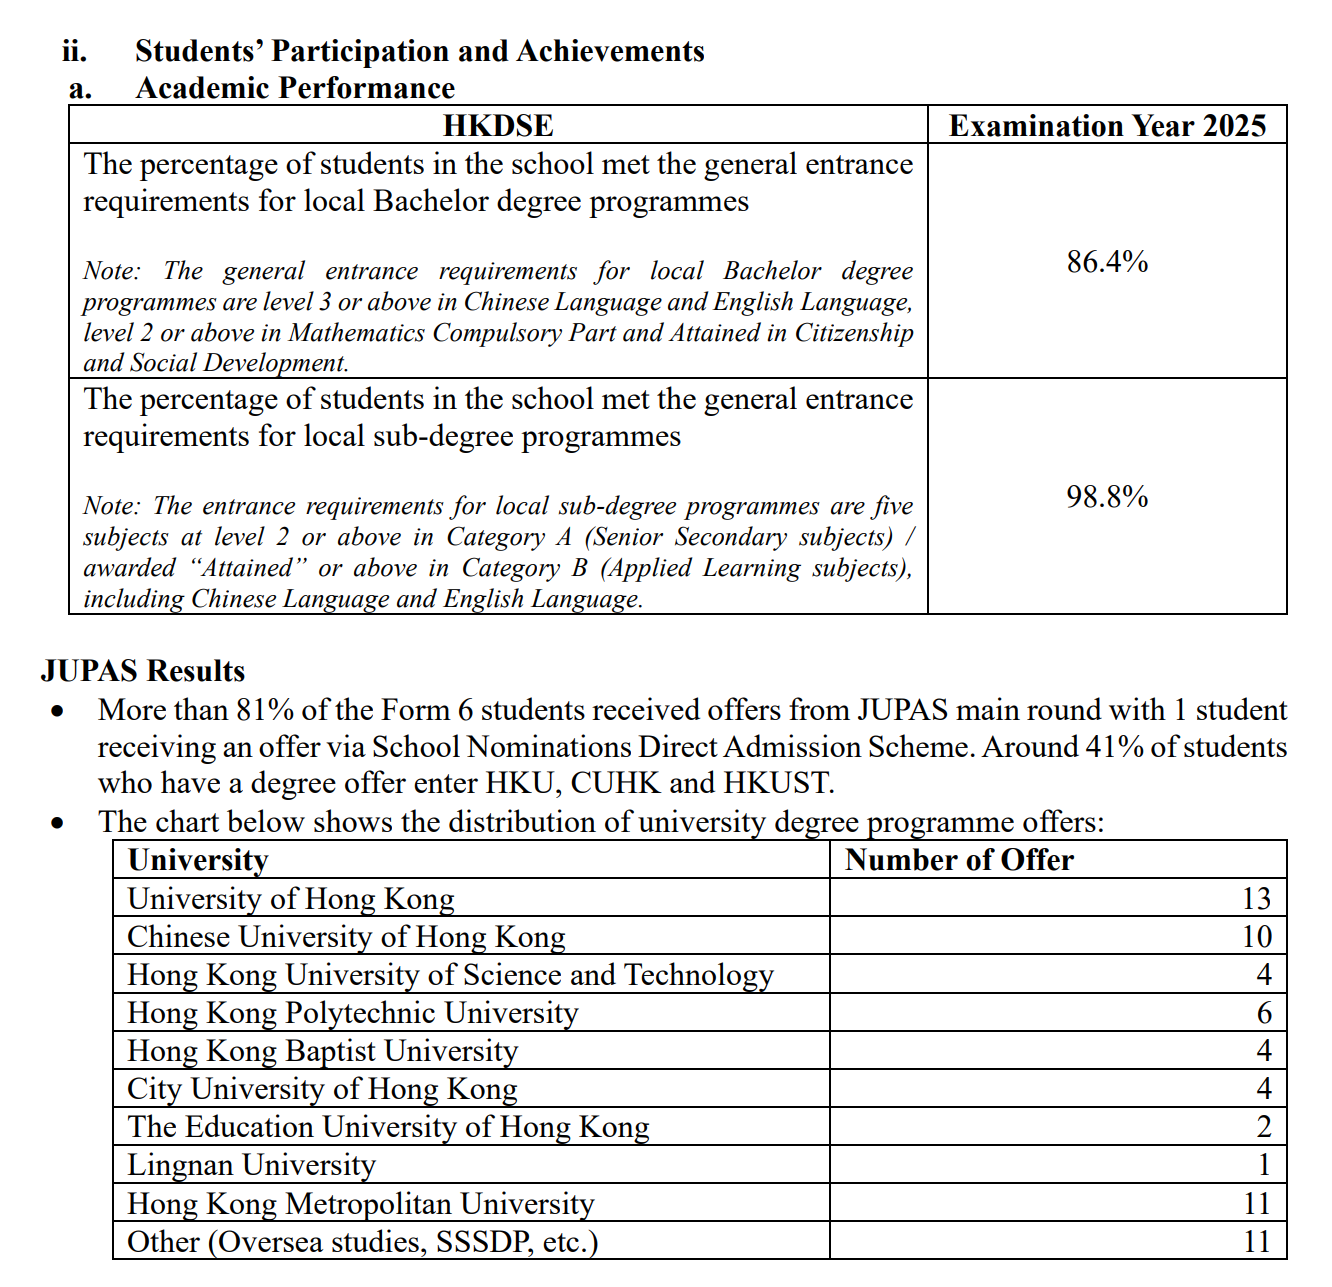
The University of Hong Kong | 13 | 19.7% | 11 | 17.7% | 11 | - | - | 中国Hong Kong |
The Chinese University of Hong Kong | 10 | 15.2% | 5 | 8.1% | 32 | - | 43 | 中国Hong Kong |
The Hong Kong University of Science and Technology | 4 | 6.1% | 10 | 16.1% | 44 | - | 60 | 中国Hong Kong |
The Hong Kong Polytechnic University | 6 | 9.1% | 5 | 8.1% | 54 | - | 80 | 中国Hong Kong |
City University of Hong Kong | 4 | 6.1% | 11 | 17.7% | 63 | - | 73 | 中国Hong Kong |
Hong Kong Baptist University | 4 | 6.1% | 2 | 3.2% | - | - | - | 中国Hong Kong |
The Education University of Hong Kong | 2 | 3.0% | - | - | - | - | - | 中国Hong Kong |
Lingnan University, Hong Kong | 1 | 1.5% | 1 | 1.6% | - | - | - | 中国Hong Kong |
Hong Kong Metropolitan University | 11 | 16.7% | - | - | - | - | - | 中国Hong Kong |
SSSDP | 11 | 16.7% | 17 | 27.4% | - | - | - |
Data Notes
Matriculation counts students who finally enroll at a university. Since each student enrolls in only one university, total matriculations usually do not exceed total graduates.
Offer counts admission offers received by students. A student may receive multiple offers, so total offers are usually higher than total graduates.
| University Name | 25 Matriculations25 Matric. | 25 Matric. %25 % | 24 Matriculations24 Matric. | 24 Matric. %24 % | QS | US | THE |
|---|---|---|---|---|---|---|---|
The University of Hong Kong | 13 | 19.7% | 11 | 17.7% | 11 | - | - |
The Chinese University of Hong Kong | 10 | 15.2% | 5 | 8.1% | 32 | - | 43 |
The Hong Kong University of Science and Technology | 4 | 6.1% | 10 | 16.1% | 44 | - | 60 |
The Hong Kong Polytechnic University | 6 | 9.1% | 5 | 8.1% | 54 | - | 80 |
City University of Hong Kong | 4 | 6.1% | 11 | 17.7% | 63 | - | 73 |
Hong Kong Baptist University | 4 | 6.1% | 2 | 3.2% | - | - | - |
The Education University of Hong Kong | 2 | 3.0% | - | - | - | - | - |
Lingnan University, Hong Kong | 1 | 1.5% | 1 | 1.6% | - | - | - |
Hong Kong Metropolitan University | 11 | 16.7% | - | - | - | - | - |
Sources
×
1 / 1
Living
Living & Commute Recommendations
| # | Estate | Best Commute | Commute Time | Distance | Overall Score |
|---|---|---|---|---|---|
| Loading... | |||||
Note: Monthly rent/total price are estimates based on government RVD monthly residential averages by area and size, for school-living decisions only.
-