
Ying Wa Girls' School
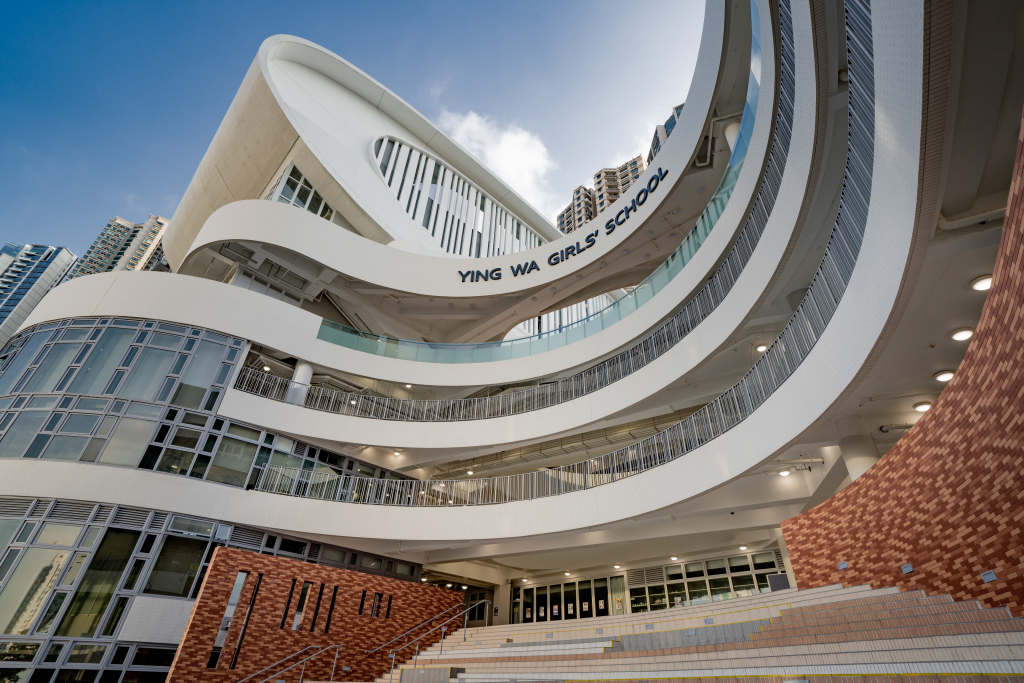
Ying Wa Girls' School
- YWGS
英华女学校(英语:Ying Wa Girls' School)创立于1900年2月,是伦敦传道会旗下的女子津贴中学,现由属下的中华基督教会香港区会负责管理,全校学生人数约860人。该校于1900年加入香港直资学校议会,亦即被坊间称为“传统名校”的22间学校之一。英华女学校主要授课语言为英语。
Overview
School Info
Band
Band 1a
School Gender
Girls
School Net
School Net Cw
Curriculum Type
ProfileType
Aided
直升安排
N/A
Curriculum Features
Hong Kong本地→DSE
Classes & Students
Age Group
12.31
Grade Setup
G7 - G12(S1 - S6)
Classes Count
5
Total Students
860人
Teaching Language
Teaching Language
English
Chinese Characters
Traditional Chinese
Religion
Religion
Christianityity
Founded
1900
费用情况
Annual Tuition
-
Other
Boarding Service
不提供寄宿
Entrance Exam
Chinese/English/Math Paper / English Interview / Cantonese Interview
Application Info
Minimum Application Grade
S1
Maximum Application Grade
S1
Application Method
By Mail / In-person Submission
Transfer Application Opens
2025/5/9
Transfer Application Deadline
2025/5/30
Useful Links
Contact
Phone
(852) 2546 3151 / 2546 3151
Email
school@ywgs.edu.hk
Address
Hong Kong Island Central & Western District 中环罗便臣道 76 号
Map Location
英華 Girls Profile
Fees
Fee Information
| Grade | School Level | Age | Fees | Stage |
|---|---|---|---|---|
| G10 | S4 | 15 | $860 | 中四 |
| G11 | S5 | 16 | $860 | 中五 |
| G12 | S6 | 17 | $860 | 中六 |
Secondary S1 - S30
HKDSE
Secondary S4 - S6$860
HKDSE
Sources

×
1 / 1
Exam
DSE Ranking
Rank 63 / 311
Higher Ranked
Lower Ranked
DSE Overview
| Metrics | 2025 | 2024 | 2023 | Change |
|---|---|---|---|---|
| Key Metrics | ||||
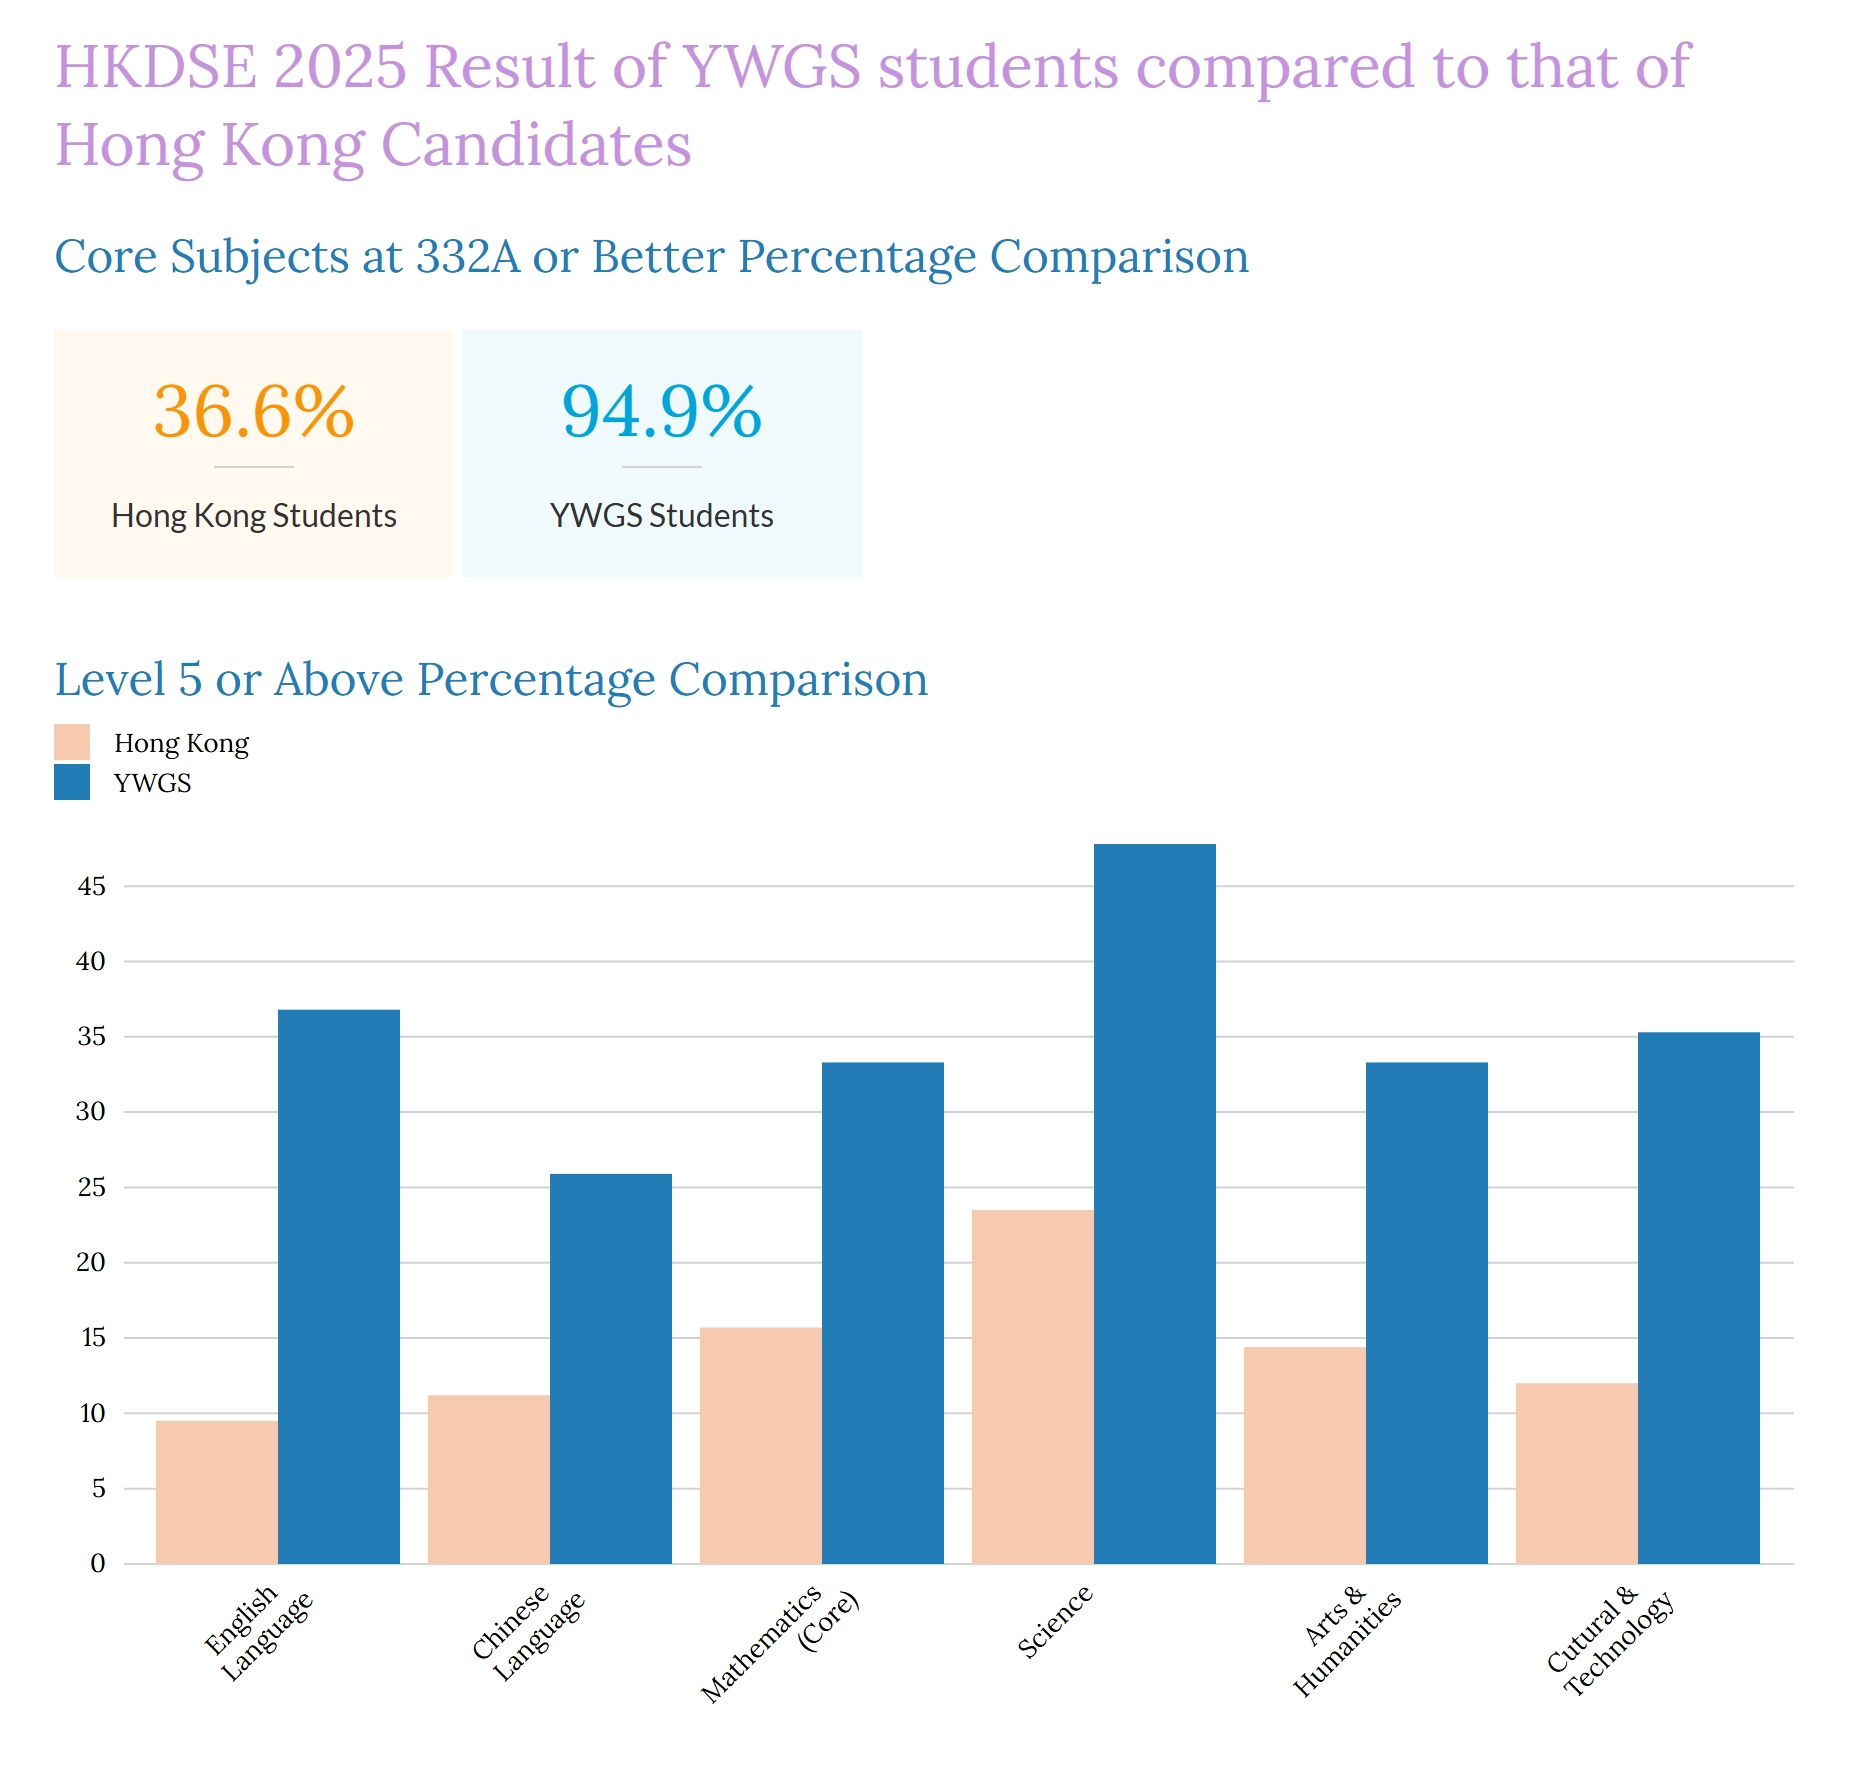
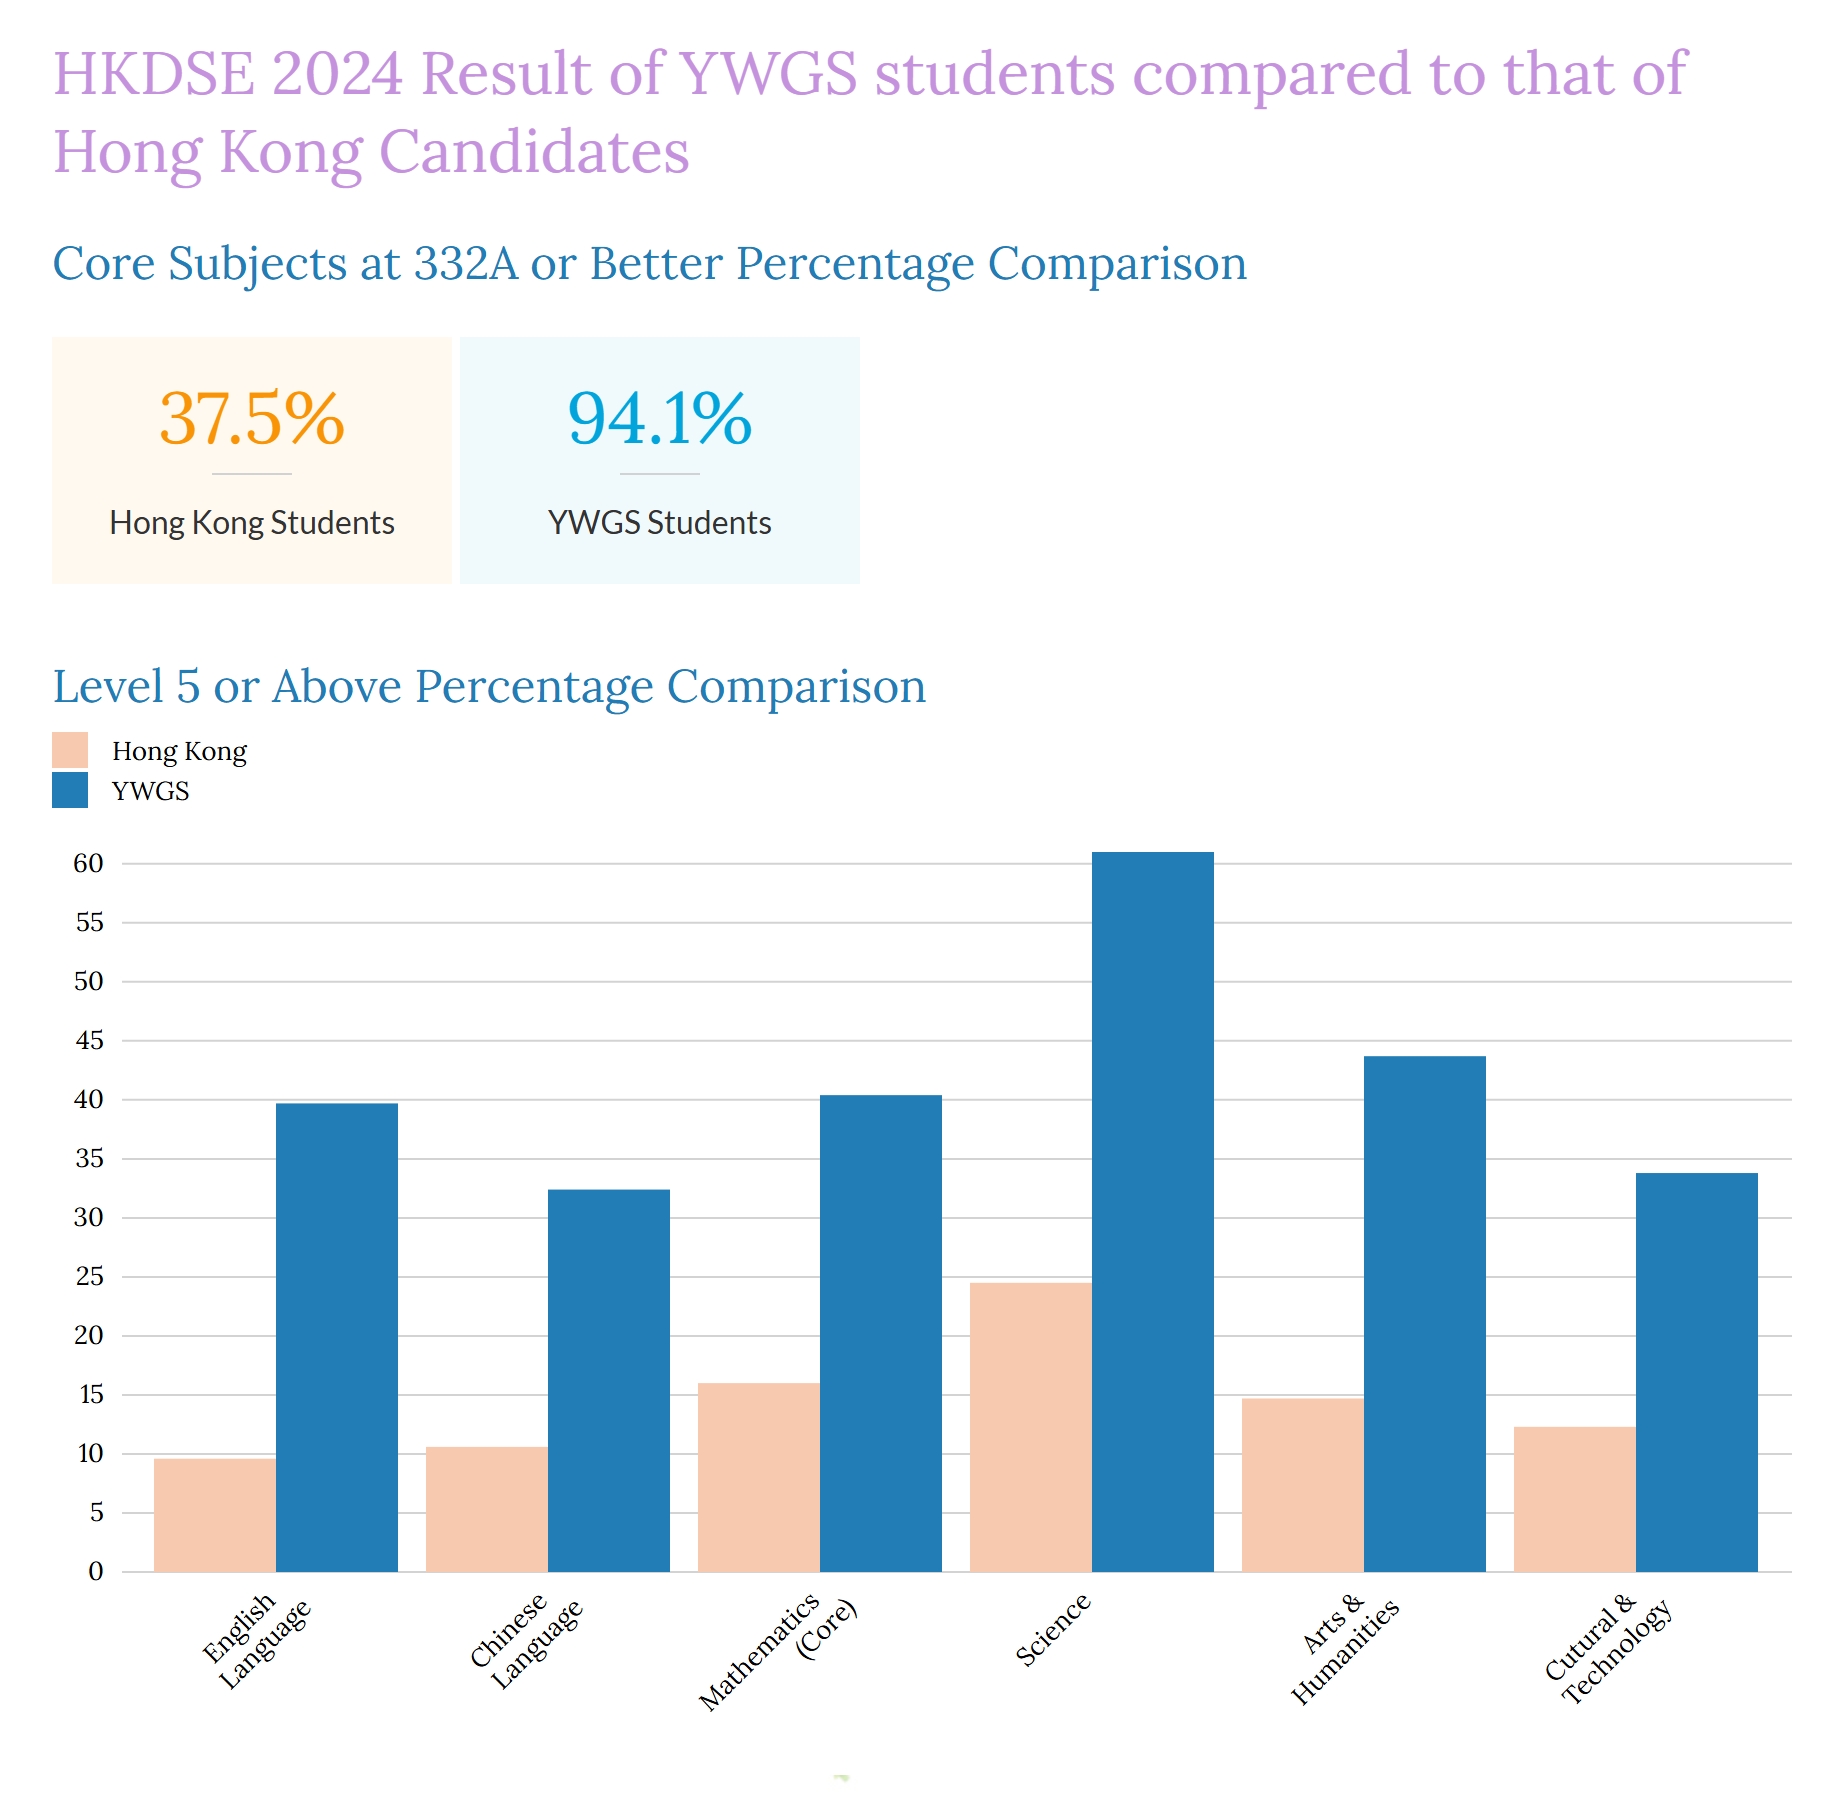
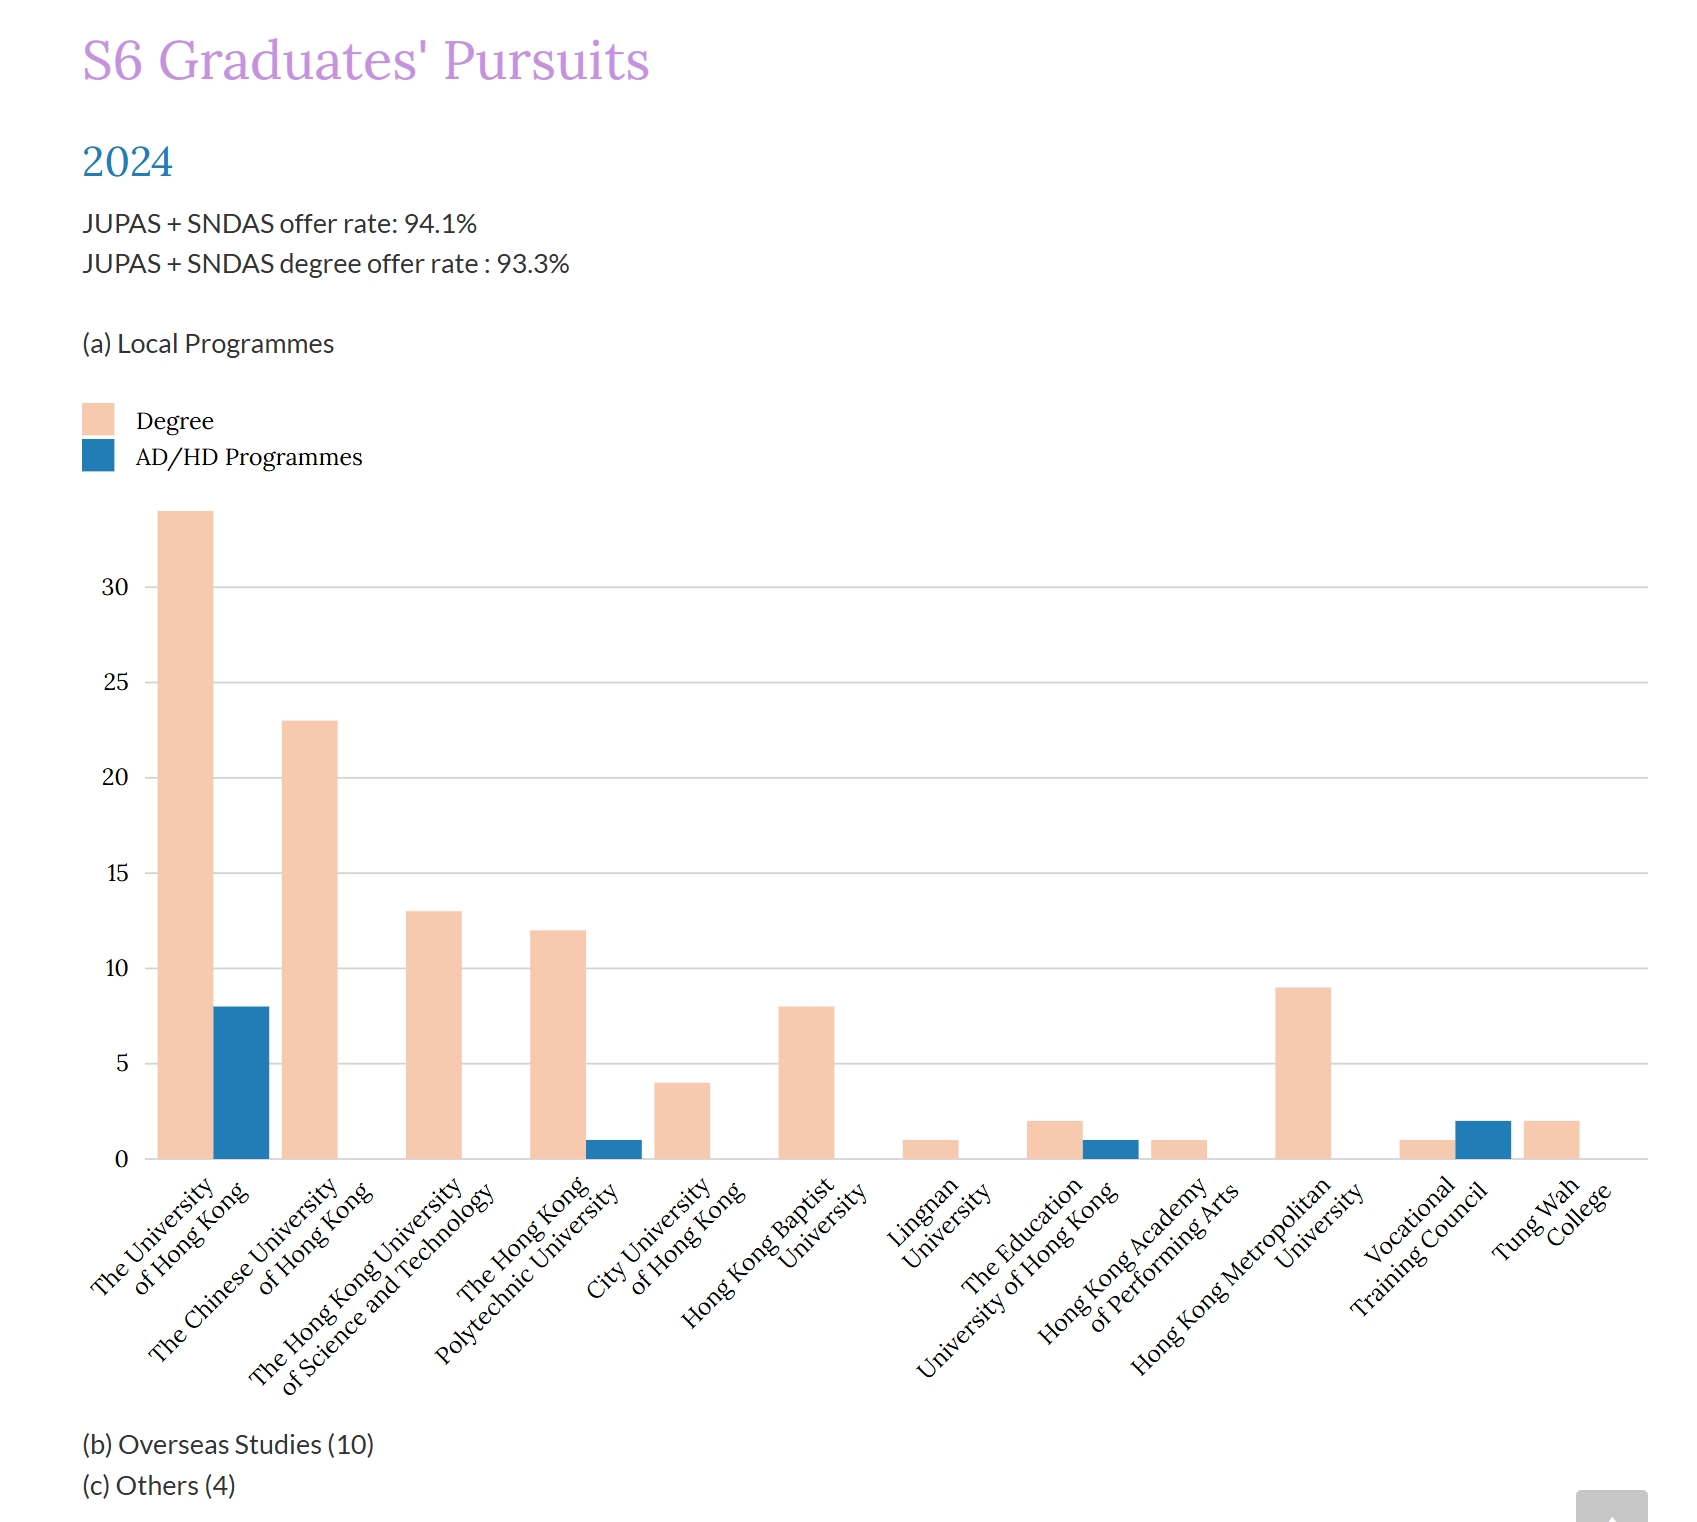
| 332A (Universities门槛) | 94.9% | 94.1% | 96.8% | ▲ 0.8% |
| 332A Notes | 332A | 332A | 33222 | - |
| Level 5+ (优秀) | ||||
| CEM 5+ (主科) | 32.0% | 37.7% | 40.6% | ▼ 5.7% |
| Chinese 5+ | 26.0% | 33.0% | 33.1% | ▼ 7.0% |
| English 5+ | 37.0% | 39.5% | 50.4% | ▼ 2.5% |
| 数学 5+ | 33.0% | 40.5% | 38.4% | ▼ 7.5% |
| 人数 | ||||
| DSE Candidates | 117 | 137 | 125 | ▼ 20 |
Sources
×
1 / 1
Placement
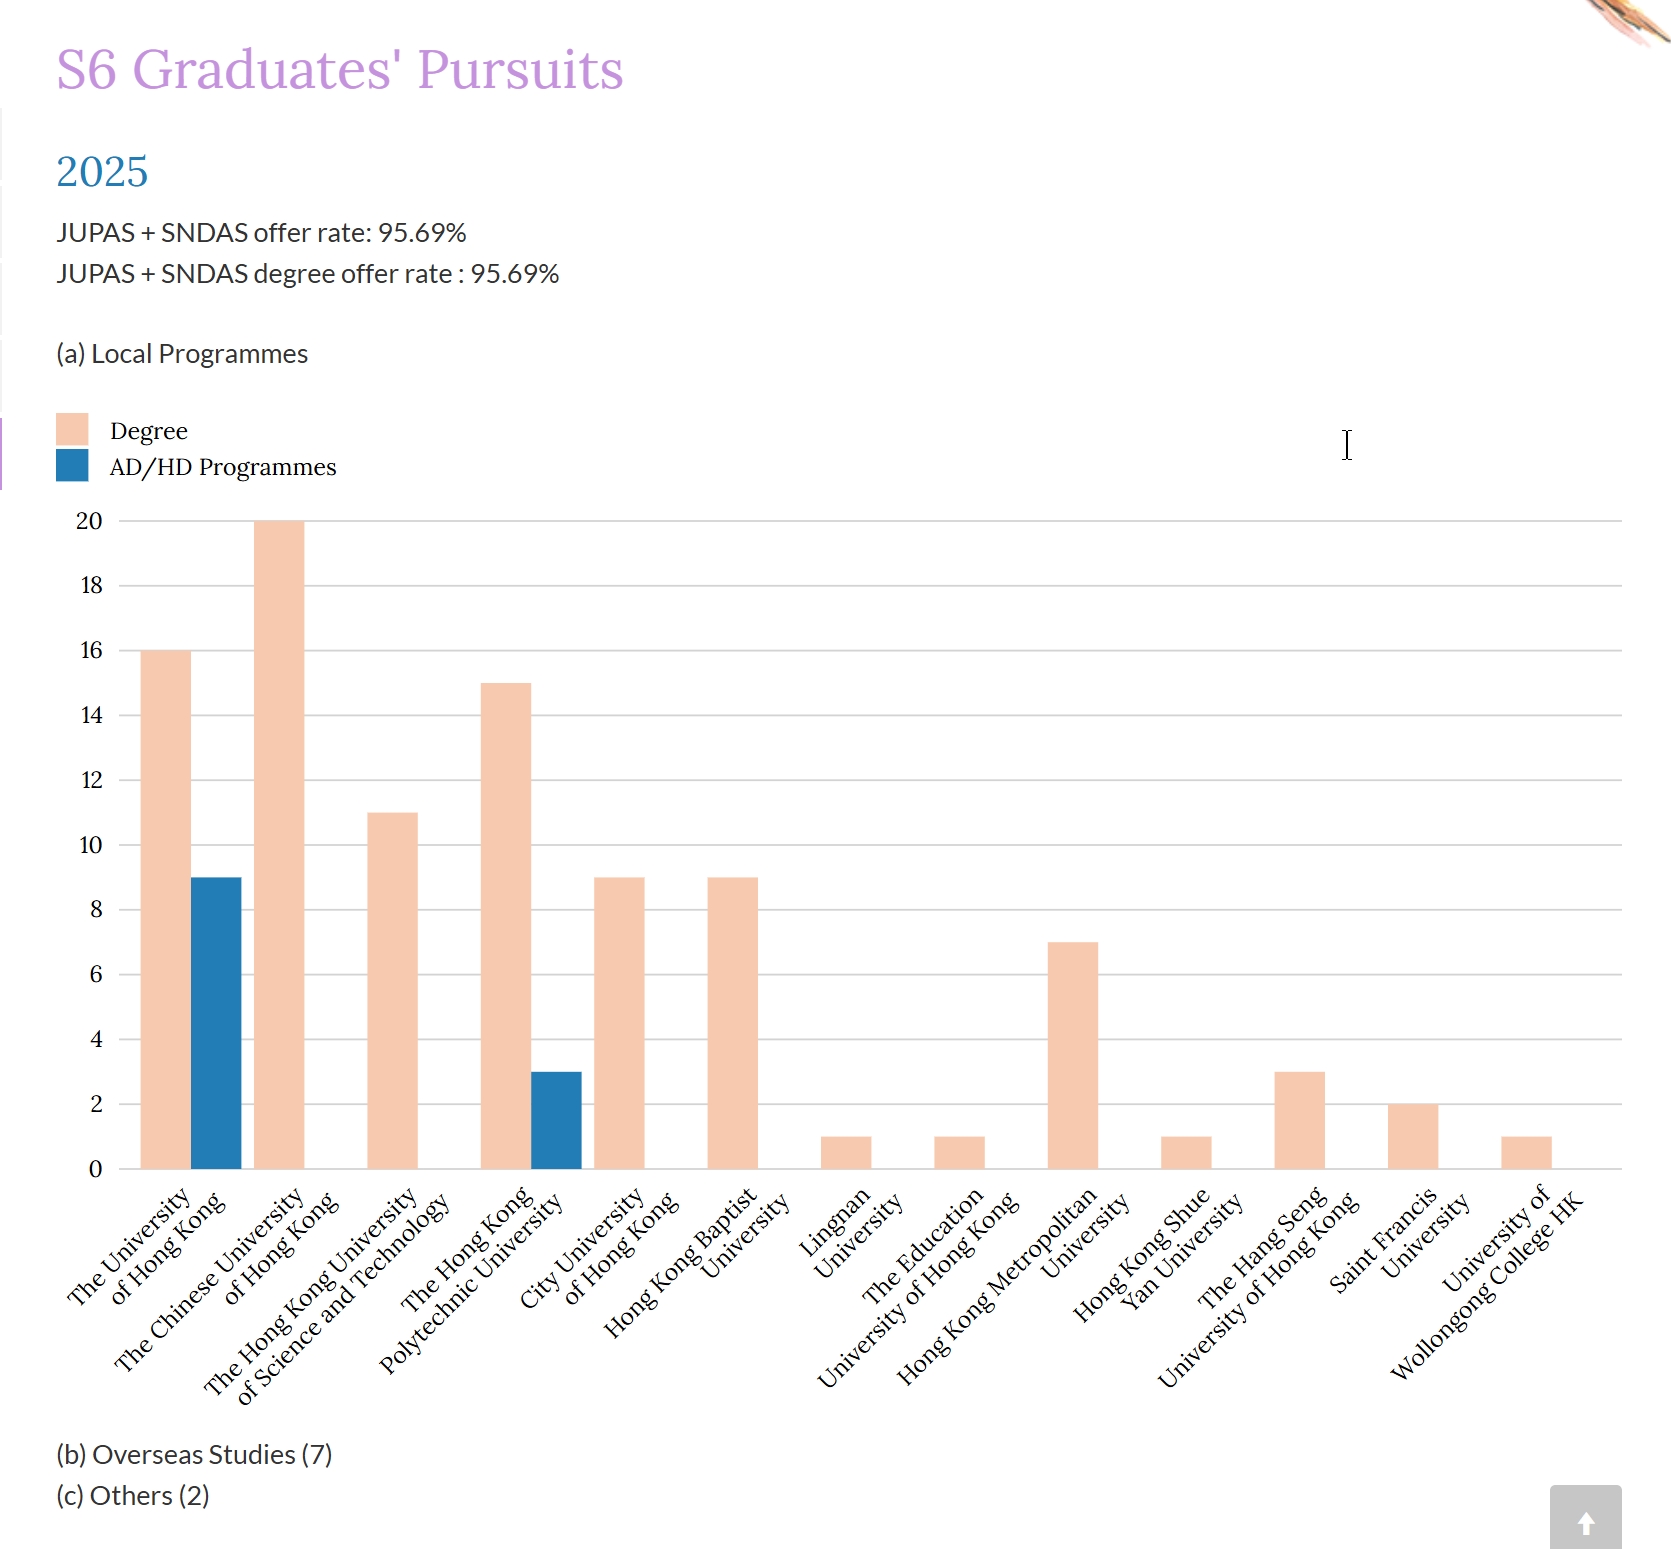
University Placement Analysis
| Placement Destinations | 2025Year | 2024Year | Change |
|---|---|---|---|
| Aided学位率 | 95.7% | 93.3% | ▲ 2.4% |
| Hong KongTop 3 Rate | 40.2% | 51.8% | ▼ 11.6% |
| Hong KongTop 4 Rate | 53.0% | 60.6% | ▼ 7.6% |
| Hong KongTop 5 Rate | 60.7% | 63.5% | ▼ 2.8% |
| Hong Kong九大率 | 76.1% | 78.1% | ▼ 2.0% |
| 总本科率(本地+Overseas) | 88.1% | 87.6% | ▲ 0.5% |
| Hong Kong本地本科率 | 82.1% | 80.3% | ▲ 1.8% |
| Overseas本科率 | 6.0% | 7.3% | ▼ 1.3% |
| 副学士学位率 | 10.3% | 8.8% | ▲ 1.5% |
| VTC率 | - | 0.7% | - |
| Progression Rate | 98.3% | 97.1% | ▲ 1.2% |
2025 University Tier Analysis
| University Tier | 2025Enrollment25Enrollment | 2025Enrollment%25% | 2025EnrollmentCumulative%25Cumulative | 2024Enrollment24Enrollment | 2024Enrollment%24% | 2024EnrollmentCumulative%24Cumulative | ΔOffers%Δ% |
|---|---|---|---|---|---|---|---|
| Total Students | - | - | - | 125 | 100.0% | - | - |
| HK Top 3 | - | - | - | 71 | 56.8% | 56.8% | - |
| HK Top 4 | - | - | - | 12 | 9.6% | 66.4% | - |
| HK Top 5 | - | - | - | 4 | 3.2% | 69.6% | - |
Detailed University Placement Results
| University Name | 25 Matriculations25 Matric. | 25 Matric. %25 % | 24 Matriculations24 Matric. | 24 Matric. %24 % | QS | US | THE | Country |
|---|---|---|---|---|---|---|---|---|
The University of Hong Kong | 16 | 13.7% | 35 | 25.5% | 11 | - | - | 中国Hong Kong |
The Chinese University of Hong Kong | 20 | 17.1% | 23 | 16.8% | 32 | - | 43 | 中国Hong Kong |
The Hong Kong University of Science and Technology | 11 | 9.4% | 13 | 9.5% | 44 | - | 60 | 中国Hong Kong |
The Hong Kong Polytechnic University | 15 | 12.8% | 12 | 8.8% | 54 | - | 80 | 中国Hong Kong |
City University of Hong Kong | 9 | 7.7% | 4 | 2.9% | 63 | - | 73 | 中国Hong Kong |
Hong Kong Baptist University | 9 | 7.7% | 8 | 5.8% | - | - | - | 中国Hong Kong |
Lingnan University, Hong Kong | 1 | 0.9% | 1 | 0.7% | - | - | - | 中国Hong Kong |
The Education University of Hong Kong | 1 | 0.9% | 2 | 1.5% | - | - | - | 中国Hong Kong |
Hong Kong Metropolitan University | 7 | 6.0% | 9 | 6.6% | - | - | - | 中国Hong Kong |
Hong Kong Shue Yan University | 1 | 0.9% | - | - | - | - | - | 中国Hong Kong |
Hang Seng University of Hong Kong | 3 | 2.6% | - | - | - | - | - | 中国Hong Kong |
Saint Francis University | 2 | 1.7% | - | - | - | - | - | 中国Hong Kong |
Kyushu University | 1 | 0.9% | - | - | - | - | - | 日本 |
Hong Kong Academy for Performing Arts | - | - | 1 | 0.7% | - | - | - | 中国Hong Kong |
Associate Degree Program | 12 | 10.3% | 12 | 8.8% | - | - | - | 副学士/预科 |
Overseas Universities | 7 | 6.0% | 10 | 7.3% | - | - | - | |
VTC Youth College | - | - | 1 | 0.7% | - | - | - | 中国Hong Kong |
Tung Wah College | - | - | 2 | 1.5% | - | - | - | 中国Hong Kong |
Others/National Service | 2 | 1.7% | 4 | 2.9% | - | - | - | Other |
Data Notes
Matriculation counts students who finally enroll at a university. Since each student enrolls in only one university, total matriculations usually do not exceed total graduates.
Offer counts admission offers received by students. A student may receive multiple offers, so total offers are usually higher than total graduates.
| University Name | 25 Matriculations25 Matric. | 25 Matric. %25 % | 24 Matriculations24 Matric. | 24 Matric. %24 % | QS | US | THE |
|---|---|---|---|---|---|---|---|
The University of Hong Kong | 16 | 13.7% | 35 | 25.5% | 11 | - | - |
The Chinese University of Hong Kong | 20 | 17.1% | 23 | 16.8% | 32 | - | 43 |
The Hong Kong University of Science and Technology | 11 | 9.4% | 13 | 9.5% | 44 | - | 60 |
The Hong Kong Polytechnic University | 15 | 12.8% | 12 | 8.8% | 54 | - | 80 |
City University of Hong Kong | 9 | 7.7% | 4 | 2.9% | 63 | - | 73 |
Hong Kong Baptist University | 9 | 7.7% | 8 | 5.8% | - | - | - |
Lingnan University, Hong Kong | 1 | 0.9% | 1 | 0.7% | - | - | - |
The Education University of Hong Kong | 1 | 0.9% | 2 | 1.5% | - | - | - |
Hong Kong Metropolitan University | 7 | 6.0% | 9 | 6.6% | - | - | - |
Hong Kong Shue Yan University | 1 | 0.9% | - | - | - | - | - |
Hang Seng University of Hong Kong | 3 | 2.6% | - | - | - | - | - |
Saint Francis University | 2 | 1.7% | - | - | - | - | - |
Hong Kong Academy for Performing Arts | - | - | 1 | 0.7% | - | - | - |
VTC Youth College | - | - | 1 | 0.7% | - | - | - |
Tung Wah College | - | - | 2 | 1.5% | - | - | - |
Sources
×
1 / 1
Living
Living & Commute Recommendations
| # | Estate | Best Commute | Commute Time | Distance | Overall Score |
|---|---|---|---|---|---|
| Loading... | |||||
Note: Monthly rent/total price are estimates based on government RVD monthly residential averages by area and size, for school-living decisions only.
-