ESF SOUTH ISLAND SCHOOL
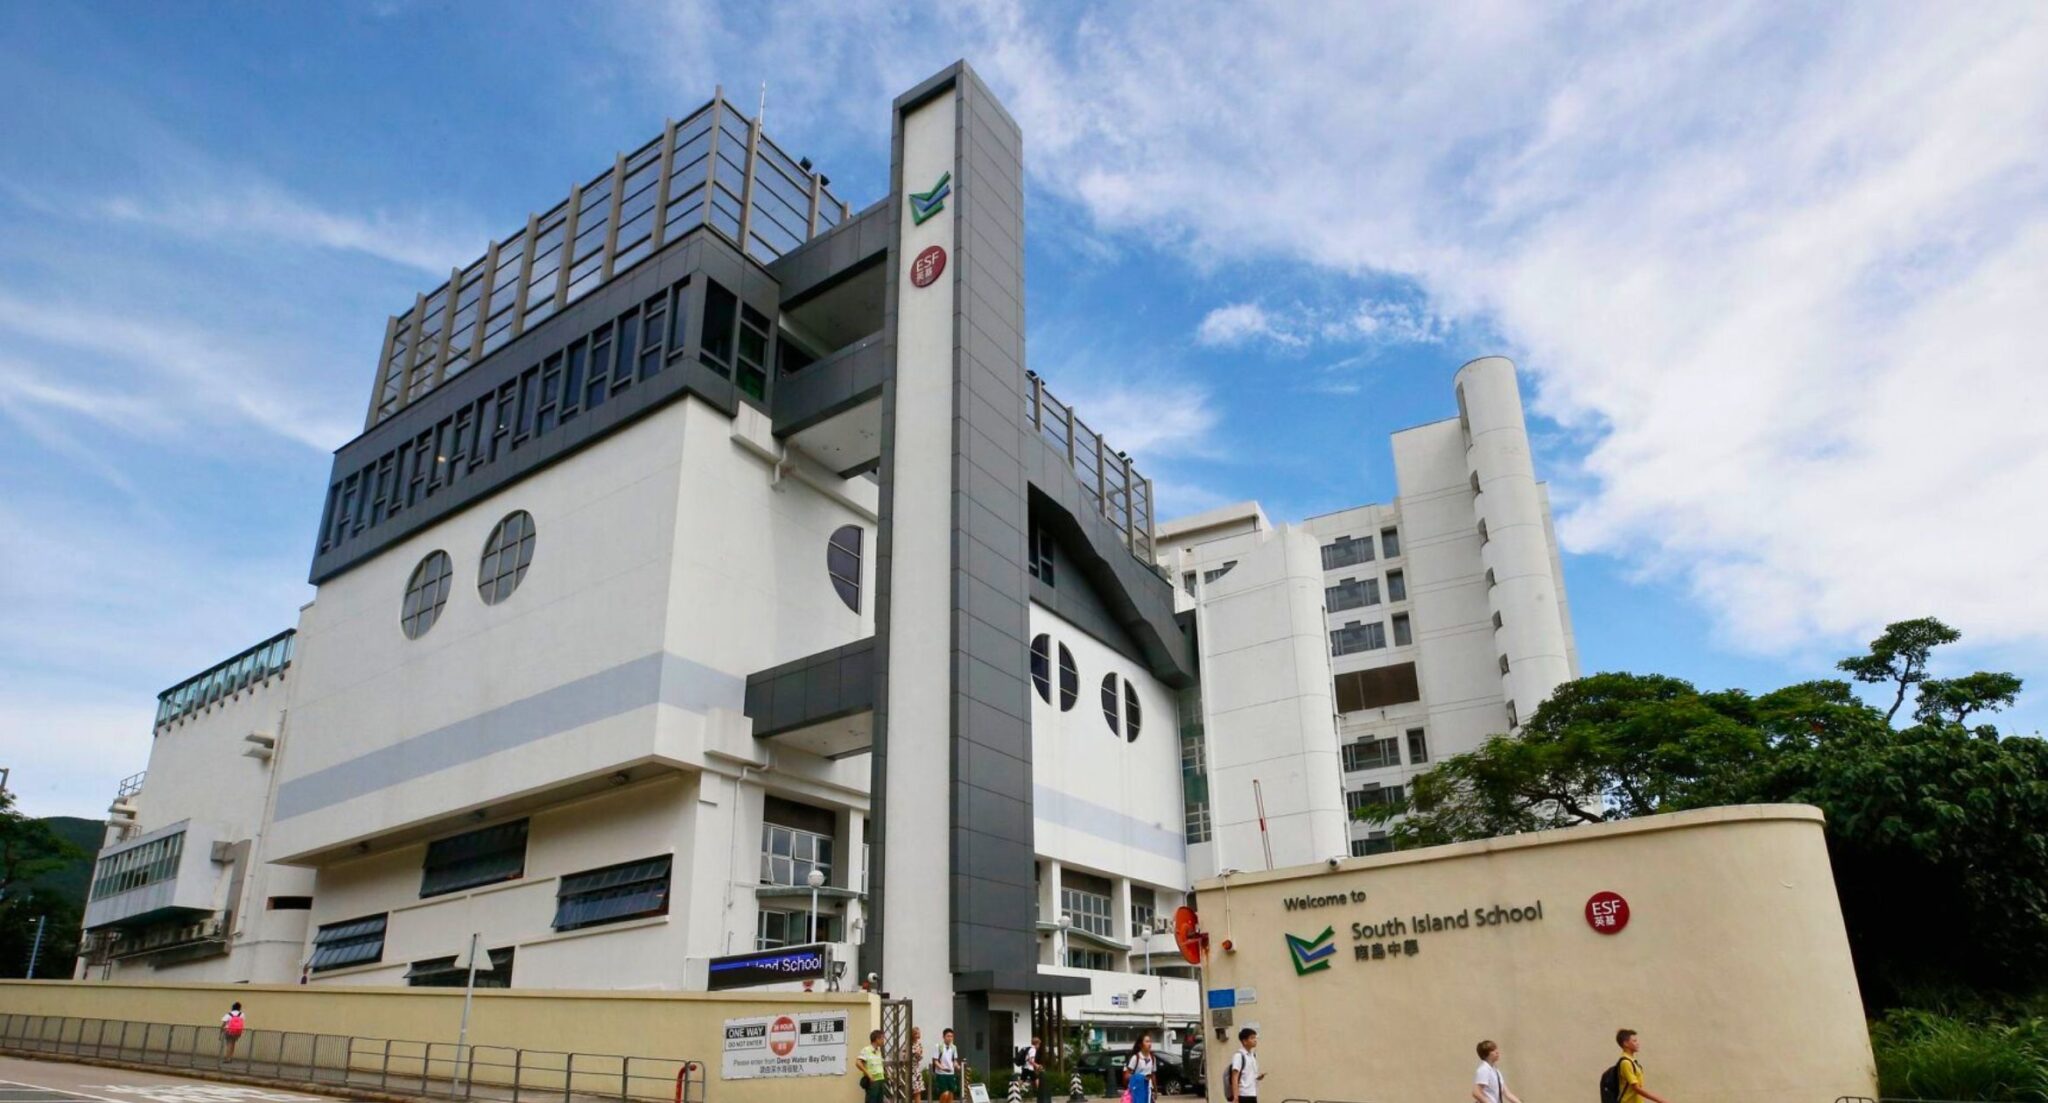
ESF SOUTH ISLAND SCHOOL
- ESF-SIS
南岛中学的学生大部分来自白普里小学直升,中文水平为英基各分校中相对优秀。Y7-Y9采用IBMYP课程,Y10-Y11采用IGCSE课程,Y12-Y13为IBDP课程。这个课程体系比较好地结合了IBMYP和IGCSE的课程优点,兼顾了学术和IB需要的实验操作和论文写作能力。但也由于IGCSE课程的限制,Y11不招收插班生。
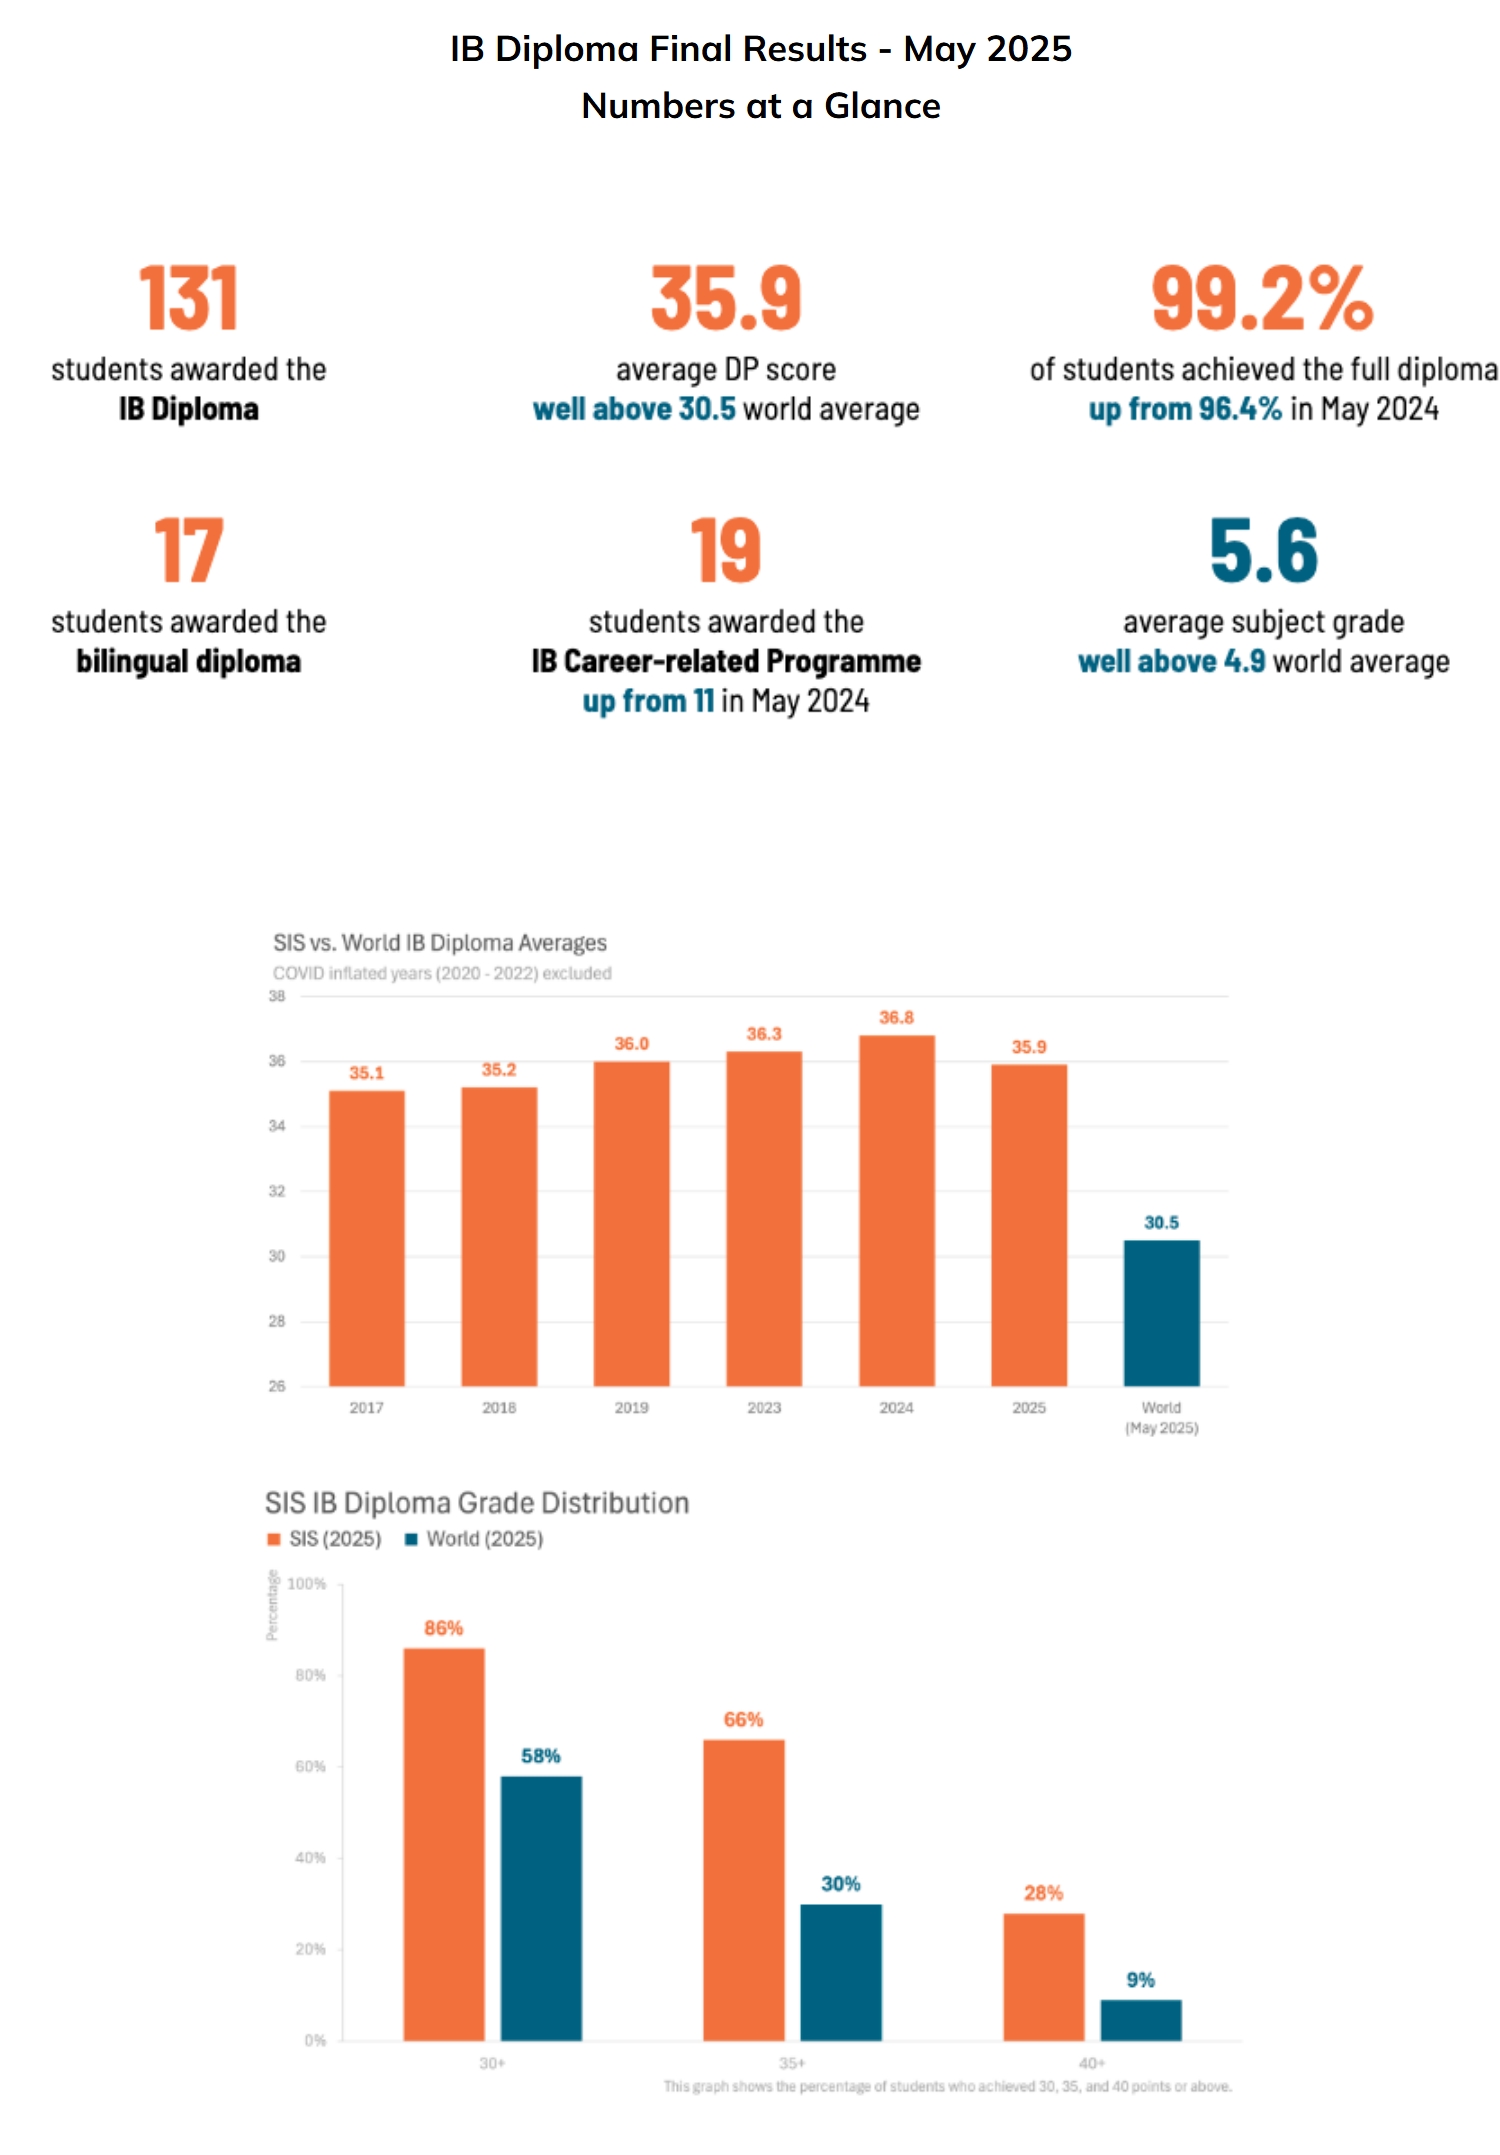
2025年IB均分为35.7分,在英基的7所分校中位居第五,在全港国际学校中位居第16名。
Overview
Curriculum Type
School Type
International
Through-train
Through-train
Curriculum Features
IBMYP / IGCSE → IBDP
Classes & Students
Age Group
12.31
Grade Setup
G6 ~ G12(Y7 - Y13)
Classes Count
6
Students / Class
30 - 40
Total Students
1,500 - 1,600
Teaching Language
Teaching Language
English
Chinese Characters
Simplified Chinese
Chinese Session
每天 1 Session
Religion
Religion
No Religion
Founded
1977
School Hours
8:00 am - 3:00 pm
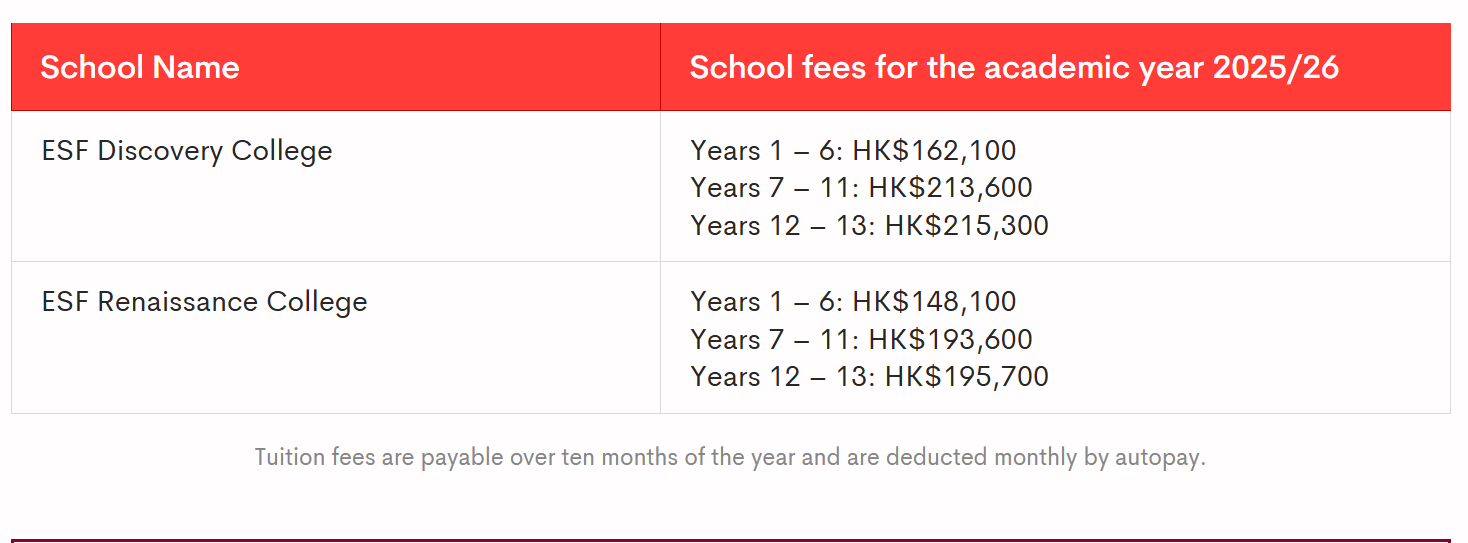
费用情况
Annual Tuition
HK$159,400 - $181,100
Capital Levy
-
Debenture
正常 Enrollment No debenture,提供可优先 Enrollment 的 50 万元 Debenture,购买后不可退还。
Other
Boarding Service
不提供寄宿
Priority Eligibility
持 Yes 企业 NR Debenture,教师子 Girls,Yes 兄弟姐妹在读 Sha Tin Primary/Secondary,持 Yes 个人 INR Debenture,ESF 在读 Students,Yes 高才签证,Yes 非港籍护照
Entrance Exam
ISEE / English Writing / English Interview
Application Info
Minimum Application Grade
G6
Maximum Application Grade
G11
Eligible Application Grades
G6 / G7 / G8 / G9 / G11 / G12
Application Method
Online Application
Transfer Application Opens
中央 Application 为每 Year Sep,插班 Application Open Year-round
Transfer Application Deadline
中央 Application 为每 Year Sep30 日,插班 Application No Deadline 日期
Useful Links
Contact
Phone
招生:(852) 2555 9313 / 咨询:(852) 2524 7135
Email
admissions@sis.edu.hk / 招生:admissions@sis.edu.hk / 咨询:sis@sis.edu.hk
Address
Hong Kong深水湾径南丰路50号
Map Location
ESF South Island School
Relation
Relationship Notes
英基白普里Primary和英基鲗鱼涌Primary的Students100%可直升英基南岛Secondary。
Fees
School Fees Ranking
Rank 50 / 98
Higher Ranked
Lower Ranked
2025-2026 Fee Information
| Grade | School Level | Age | Fees | Stage |
|---|---|---|---|---|
| G6 | Y7 | 11 | $181,100 | Lower Secondary MYP |
| G7 | Y8 | 12 | $181,100 | Lower Secondary MYP |
| G8 | Y9 | 13 | $181,100 | Lower Secondary MYP |
| G9 | Y10 | 14 | $152,200 | Upper Secondary IGCSE |
| G10 | Y11 | 15 | $159,400 | Upper Secondary IGCSE |
| G11 | Y12 | 16 | $167,600 | Upper Secondary IBDP |
| G12 | Y13 | 17 | $167,600 | Upper Secondary IBDP |
Secondary Y7 - Y10$181,100
IBMYP+IGCSE
Secondary Y11$159,400
IBMYP+IGCSE
Secondary Y12 - Y13$167,600
IBDP
Other Fees
Capital Levy-
Debenture (Mandatory Purchase)HK$38,000
不退还
Refundable Debenture-
Enrollment后None须购买Debenture
Non-refundable Debenture-
No non-refundable debenture
Nomination Right DebentureHK$500,000
购买INR可优先获得面试机会,但不代表保证Offers。没通过面试则会退还5万元的Debenture订金。
Enrollment FeeHK$3,800 - 26,000
新 Enrollment Students 要一次性缴纳该 Grade 要求的 NCL(不可退还 Capital Levy,相当于 Sign up 费),Primary 在英基就读的 Students 则 None 需缴纳。Y7 缴纳 HK$26,000,依次递减,Y13 则缴纳 HK$3,800
Sources

×
1 / 1
Exam
IB Ranking
Rank 23 / 36
Higher Ranked
Lower Ranked
IB Overview
| Metrics | 2025 | 2024 | 2023 | Change |
|---|---|---|---|---|
| Key Metrics | ||||
| Average Ranking Score | 35.9 | 36.5 | 36.1 | ▼ 0.6 |
| 合格人数 (合格率) | 130 | 99.2% | - | 127 | 98.0% | - |
| 单科均分 | 5.6 | 5.7 | 5.6 | ▼ 0.1 |
| 双语文凭人数 (双语文凭率) | 17 | 13.0% | 18 | 13.4% | - | ▼ 1.0 |
| 人数指标 | ||||
| IB Candidates (IB人数比例) | 131 | 87.3% | 134 | 92.4% | 130 | ▼ 3.0 |
| 非 IB Candidates (非IB人数比例) | 19 | 12.7% | 11 | 7.6% | - | ▲ 8.0 |
| Total Students | 150 | 145 | - | ▲ 5.0 |
| 高分段人数分布 | ||||
| IB 45分人数 (IB45分%) | 1 | 0.8% | 4 | 3.0% | - | ▼ 3.0 |
| IB 44分人数 (IB44分%) | 2 | 1.5% | 5 | 3.7% | - | ▼ 3.0 |
| IB 43分人数 (IB43分%) | 9 | 6.9% | - | - | - |
| 各分数段Cumulative人数 | ||||
| IB 40+人数 (IB40+%) | 37 | 28.0% | 40 | 29.5% | 46 | 35.0% | ▼ 3.0 |
| IB 35+人数 (IB35+%) | 86 | 66.0% | 91 | 68.0% | 83 | 64.0% | ▼ 5.0 |
| IB 30+人数 (IB30+%) | 113 | 86.0% | 121 | 90.0% | 108 | 83.0% | ▼ 8.0 |
Sources
×
1 / 1
Placement
University Placement Ranking
Rank 23 / 31
Higher Ranked
Lower Ranked
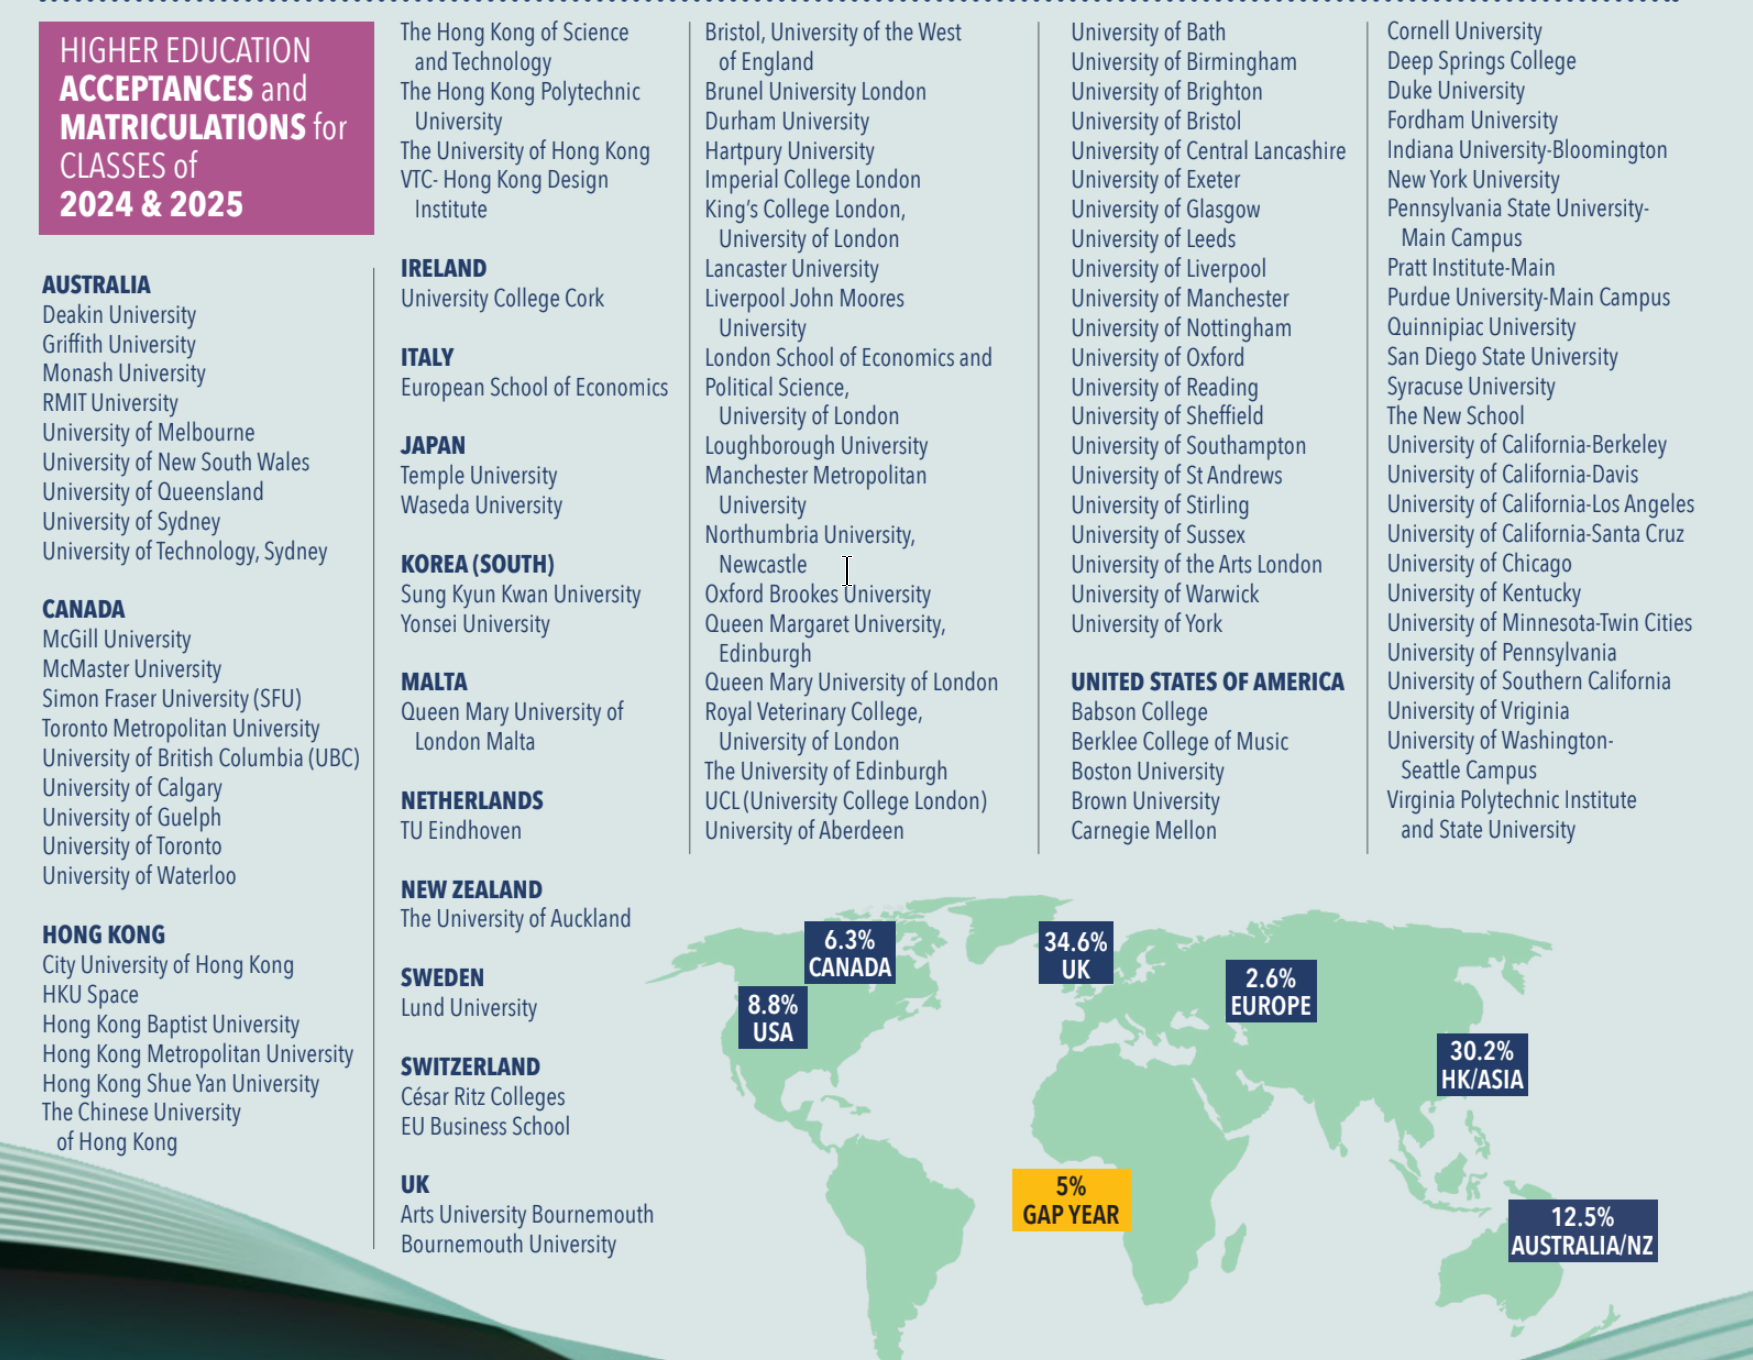
2025 Study-abroad Country Analysis
24Enrollment
25Offers
| Country/Region | 24Enrollment | Share | 25Offers | Share |
|---|---|---|---|---|
| United States | 19 | 13.8% | 31 | 27.4% |
| United Kingdom | 51 | 37.0% | 44 | 38.9% |
| Hong Kong | 31 | 22.5% | 10 | 8.8% |
| Canada | 21 | 15.2% | 9 | 8.0% |
| Australia | 10 | 7.2% | 10 | 8.8% |
| Europe | 5 | 3.6% | 6 | 5.3% |
| Asia | 1 | 0.7% | 3 | 2.7% |
| Total | 138 | 100.0% | 113 | 100.0% |
2025 University Tier Analysis
| University Tier | 25Offers25Offers | 25Offers%25% | 25OffersCumulative%25Cumulative | 24Offers24Offers | 24Offers%24% | 24OffersCumulative%24Cumulative | ΔOffers%Δ% |
|---|---|---|---|---|---|---|---|
| Total Students | 150 | 100.0% | - | 145 | 100.0% | - | - |
| Ivy League | 3 | 2.0% | - | - | - | - | +2.0% |
| US Top 10 | 3 | 2.0% | 2.0% | - | - | - | +2.0% |
| US Top 20 | 5 | 3.3% | 5.3% | - | - | - | +3.3% |
| UK Oxbridge | 1 | 0.7% | 6.0% | - | - | - | +0.7% |
| US Top 30 | 2 | 1.3% | 7.3% | - | - | - | +1.3% |
| UK G5 | 3 | 2.0% | 9.3% | - | - | - | +2.0% |
| HK Top 3 | 3 | 2.0% | 11.3% | - | - | - | +2.0% |
| Liberal Arts Top 10 | 1 | 0.7% | 12.0% | - | - | - | +0.7% |
| US Top 50 | 5 | 3.3% | 15.3% | - | - | - | +3.3% |
| HK Top 4 | 1 | 0.7% | 16.0% | - | - | - | +0.7% |
| Canada Top 3 | 3 | 2.0% | 18.0% | - | - | - | +2.0% |
| Asia Top | 1 | 0.7% | 18.7% | - | - | - | +0.7% |
| UK Top 10 | 5 | 3.3% | 22.0% | - | - | - | +3.3% |
| HK Top 5 | 1 | 0.7% | 22.7% | - | - | - | +0.7% |
| QS Top 100 | 8 | 5.3% | 28.0% | - | - | - | +5.3% |
| US Top 100 | 7 | 4.7% | 32.7% | - | - | - | +4.7% |
| US Top 100+ | 5 | 3.3% | 36.0% | - | - | - | +3.3% |
2024-2025 Detailed University Placement Results
| University Name | 25 Offers25 Offers | 25 Offer %25 % | 24 Matriculations24 Matric. | 24 Matric. %24 % | QS | US | THE | Country |
|---|---|---|---|---|---|---|---|---|
Cornell University | 1 | 0.7% | 1 | 0.7% | 16 | 12 | 18 | United States |
Carnegie Mellon University | 1 | 0.7% | - | - | 52 | 20 | 24 | United States |
Duke University | 1 | 0.7% | - | - | 62 | 7 | 28 | United States |
City University of Hong Kong | 1 | 0.7% | 1 | 0.7% | 63 | - | 73 | 中国Hong Kong |
Brown University | 1 | 0.7% | 1 | 0.7% | 69 | 13 | 65 | United States |
Boston University | 1 | 0.7% | - | - | 88 | 42 | 76 | United States |
Durham University | 1 | 0.7% | - | - | 94 | - | 175 | United Kingdom |
Abertay University | - | - | 1 | 0.7% | - | - | - | United Kingdom |
Amsterdam University of Applied Sciences | - | - | 1 | 0.7% | - | - | - | 荷兰 |
Arts University Bournemouth | 1 | 0.7% | - | - | - | - | - | United Kingdom |
Babson College | 1 | 0.7% | - | - | - | - | - | United States |
Barnard College | - | - | 1 | 0.7% | - | - | - | United States |
Bates College | - | - | 1 | 0.7% | - | - | - | United States |
Berklee College of Music | 1 | 0.7% | - | - | - | - | - | United States |
Bournemouth University | 1 | 0.7% | - | - | - | - | - | United Kingdom |
Brunel University London | 1 | 0.7% | - | - | - | - | - | United Kingdom |
Cape Breton University | - | - | 1 | 0.7% | - | - | - | Canada |
Cesar Ritz Colleges Switzerland | 1 | 0.7% | - | - | - | - | - | 瑞典 |
Deakin University | 1 | 0.7% | - | - | - | - | - | Australia |
Deep Springs College | 1 | 0.7% | - | - | - | - | - | United States |
Data Notes
Matriculation counts students who finally enroll at a university. Since each student enrolls in only one university, total matriculations usually do not exceed total graduates.
Offer counts admission offers received by students. A student may receive multiple offers, so total offers are usually higher than total graduates.
| University Name | 25 Offers25 Offers | 25 Offer %25 % | 24 Matriculations24 Matric. | 24 Matric. %24 % | QS | US | THE |
|---|---|---|---|---|---|---|---|
Duke University | 1 | 0.7% | - | - | 62 | 7 | 28 |
Cornell University | 1 | 0.7% | 1 | 0.7% | 16 | 12 | 18 |
Brown University | 1 | 0.7% | 1 | 0.7% | 69 | 13 | 65 |
Carnegie Mellon University | 1 | 0.7% | - | - | 52 | 20 | 24 |
Georgetown University | - | - | 1 | 0.7% | 285 | 24 | - |
New York University | 1 | 0.7% | 1 | 0.7% | 55 | 32 | 32 |
Boston University | 1 | 0.7% | - | - | 88 | 42 | 76 |
Purdue University | 1 | 0.7% | - | - | 88 | 46 | 85 |
Pennsylvania State University | 1 | 0.7% | - | - | 82 | 59 | - |
Indiana University Bloomington | 1 | 0.7% | - | - | 306 | 73 | 198 |
Fordham University | 1 | 0.7% | - | - | - | 97 | - |
Loyola Marymount University | - | - | 2 | 1.4% | - | 102 | - |
San Diego State University | 1 | 0.7% | - | - | - | 117 | - |
Quinnipiac University | 1 | 0.7% | - | - | - | 179 | - |
Babson College | 1 | 0.7% | - | - | - | - | - |
Barnard College | - | - | 1 | 0.7% | - | - | - |
Bates College | - | - | 1 | 0.7% | - | - | - |
Berklee College of Music | 1 | 0.7% | - | - | - | - | - |
Deep Springs College | 1 | 0.7% | - | - | - | - | - |
Pratt Institute | 1 | 0.7% | 1 | 0.7% | - | - | - |
| University Name | 25 Offers25 Offers | 25 Offer %25 % | 24 Matriculations24 Matric. | 24 Matric. %24 % | QS | US | THE |
|---|---|---|---|---|---|---|---|
Imperial College London | 1 | 0.7% | 4 | 2.9% | 2 | - | 8 |
King's College London | 1 | 0.7% | 2 | 1.4% | 31 | - | - |
London School of Economics and Political Science | 1 | 0.7% | - | - | 56 | - | 52 |
Durham University | 1 | 0.7% | - | - | 94 | - | 175 |
Abertay University | - | - | 1 | 0.7% | - | - | - |
Arts University Bournemouth | 1 | 0.7% | - | - | - | - | - |
Bournemouth University | 1 | 0.7% | - | - | - | - | - |
Brunel University London | 1 | 0.7% | - | - | - | - | - |
Hartpury University | 1 | 0.7% | - | - | - | - | - |
Lancaster University | 1 | 0.7% | 1 | 0.7% | - | - | 184 |
Liverpool John Moores University | 1 | 0.7% | - | - | - | - | - |
Queen Mary University of London, Malta Campus | 1 | 0.7% | - | - | - | - | - |
Loughborough University | 1 | 0.7% | 1 | 0.7% | - | - | - |
Manchester Metropolitan University | 1 | 0.7% | - | - | - | - | - |
Newcastle University | - | - | 2 | 1.4% | - | - | 144 |
Northumbria University | 1 | 0.7% | - | - | - | - | - |
Oxford Brookes University | 1 | 0.7% | 1 | 0.7% | - | - | - |
Queen Margaret University , Edinburgh | 1 | 0.7% | - | - | - | - | - |
Queen Mary University of London | 1 | 0.7% | - | - | - | - | 134 |
Ravensbourne University London | - | - | 1 | 0.7% | - | - | - |
| University Name | 25 Offers25 Offers | 25 Offer %25 % | 24 Matriculations24 Matric. | 24 Matric. %24 % | QS | US | THE |
|---|---|---|---|---|---|---|---|
The University of Hong Kong | 1 | 0.7% | 19 | 13.8% | 11 | - | - |
The Chinese University of Hong Kong | 1 | 0.7% | 3 | 2.2% | 32 | - | 43 |
The Hong Kong University of Science and Technology | 1 | 0.7% | 3 | 2.2% | 44 | - | 60 |
The Hong Kong Polytechnic University | 1 | 0.7% | 2 | 1.4% | 54 | - | 80 |
City University of Hong Kong | 1 | 0.7% | 1 | 0.7% | 63 | - | 73 |
HKU SPACE | 1 | 0.7% | - | - | - | - | - |
Hong Kong Baptist University | 1 | 0.7% | 1 | 0.7% | - | - | - |
Hong Kong Metropolitan University | 1 | 0.7% | - | - | - | - | - |
Hong Kong Shue Yan University | 1 | 0.7% | - | - | - | - | - |
UOW College Hong Kong | - | - | 1 | 0.7% | - | - | - |
Hong Kong Design Institute | 1 | 0.7% | - | - | - | - | - |
Yew Chung College of Early Childhood Education | - | - | 1 | 0.7% | - | - | - |
| University Name | 25 Offers25 Offers | 25 Offer %25 % | 24 Matriculations24 Matric. | 24 Matric. %24 % | QS | US | THE | Country |
|---|---|---|---|---|---|---|---|---|
Lund University | 1 | 0.7% | - | - | 72 | - | 95 | 瑞典 |
Amsterdam University of Applied Sciences | - | - | 1 | 0.7% | - | - | - | 荷兰 |
Cesar Ritz Colleges Switzerland | 1 | 0.7% | - | - | - | - | - | 瑞典 |
Erasmus University Rotterdam | - | - | 1 | 0.7% | - | - | 107 | 荷兰 |
EU Business School | 1 | 0.7% | 1 | 0.7% | - | - | - | 德国 |
European School of Economics | 1 | 0.7% | - | - | - | - | - | 意大利 |
IE University | - | - | 1 | 0.7% | - | - | - | 西班牙 |
Eindhoven University of Technology | 1 | 0.7% | - | - | - | - | 192 | 荷兰 |
University College Cork | 1 | 0.7% | - | - | - | - | - | 爱尔兰 |
Vrije Universiteit Amsterdam | - | - | 1 | 0.7% | - | - | 176 | 荷兰 |
| University Name | 25 Offers25 Offers | 25 Offer %25 % | 24 Matriculations24 Matric. | 24 Matric. %24 % | QS | US | THE |
|---|---|---|---|---|---|---|---|
McGill University | 1 | 0.7% | - | - | 27 | - | 42 |
University of Toronto | 1 | 0.7% | 9 | 6.5% | 29 | - | 21 |
University of British Columbia | 1 | 0.7% | 6 | 4.3% | 40 | - | 45 |
Cape Breton University | - | - | 1 | 0.7% | - | - | - |
Laurentian University | - | - | 1 | 0.7% | - | 1631 | - |
McMaster University | 1 | 0.7% | - | - | - | - | 116 |
OCAD University | - | - | 1 | 0.7% | - | - | - |
Simon Fraser University | 1 | 0.7% | - | - | - | - | - |
Toronto Metropolitan University | 1 | 0.7% | - | - | - | - | - |
University of Calgary | 1 | 0.7% | 1 | 0.7% | - | - | 200 |
University of Guelph | 1 | 0.7% | 1 | 0.7% | - | - | - |
University of Waterloo | 1 | 0.7% | - | - | - | - | 162 |
Western University | - | - | 1 | 0.7% | - | - | - |
| University Name | 25 Offers25 Offers | 25 Offer %25 % | 24 Matriculations24 Matric. | 24 Matric. %24 % | QS | US | THE |
|---|---|---|---|---|---|---|---|
The University of Melbourne | 1 | 0.7% | 2 | 1.4% | 19 | - | - |
The University of Sydney | 1 | 0.7% | 1 | 0.7% | 25 | - | 54 |
Monash University | 1 | 0.7% | 2 | 1.4% | 36 | - | 58 |
University of Technology Sydney | 1 | 0.7% | - | - | 96 | - | 145 |
Deakin University | 1 | 0.7% | - | - | - | - | - |
Griffith University | 1 | 0.7% | - | - | - | - | - |
La Trobe University | - | - | 2 | 1.4% | - | - | - |
Macquarie University | - | - | 1 | 0.7% | - | - | 166 |
RMIT University | 1 | 0.7% | - | - | - | - | - |
The University of Auckland | 1 | 0.7% | - | - | - | - | - |
University of New South Wales | 1 | 0.7% | - | - | - | - | - |
University of Queensland | 1 | 0.7% | 2 | 1.4% | - | - | - |
| University Name | 25 Offers25 Offers | 25 Offer %25 % | 24 Matriculations24 Matric. | 24 Matric. %24 % | QS | US | THE | Country |
|---|---|---|---|---|---|---|---|---|
National University of Singapore | - | - | 1 | 0.7% | 8 | - | 17 | 新加坡 |
Yonsei University | 1 | 0.7% | - | - | 50 | - | 86 | 韩国 |
Sungkyunkwan University | 1 | 0.7% | - | - | - | - | 87 | 韩国 |
Waseda University | 1 | 0.7% | - | - | - | - | - | 日本 |
Sources

24 Admission Results
×
1 / 1
Apply
Application Timeline
| General Grade | School Grade | Application Start | Application Deadline | Assessment Date | Admission Date |
|---|---|---|---|---|---|
| G6 | Y7 | 2025/9/1 | 2025/9/30 | 2025/11 | 2025/12 |
| G7-G11 | Y8-Y12 | 全Year接收Application | 根据Application Timeline和优先权确定 | 面试后一周内 |
Application Process
| No. | Steps |
|---|---|
| Grade: | |
| 1 | 网上 Submit Application,Y7 要在 Enrollment 前一 Year 的 Sep Submit Application,Y11 和 Y13 以外的 Other Grade 全 Year 都可以 Application |
| 2 | 若 Yes Reference 缺失,英基会回复邮件提醒补充 Submit |
| 3 | 若是Y7中央Application,一般在Nov会通知笔试,若No通知,则是没排到,只能等待第二轮的机会 |
| 4 | 若是插班Application,则要等待Profile通知才Yes笔试,这个时间不定,可能等待1-2Year,取决于该Grade的Application空缺和Application人的优先级 |
| 5 | 笔试通过后会安排面试,若笔试没通过,则直接收拒信,半Year后才能重新Application |
| 6 | 中央Application面试一般通过后一个月内发Offers通知,插班面试通过后一周左右会发Offers通知 |
Admission Assessment
| No. | Assessment |
|---|---|
| Grade: Y7 - Y12 | |
| 1 | English笔试(阅读、写作)和面试 |
| 2 | 插班考试一周后公布结果 |
| 3 | English笔试(阅读、写作)和数学笔试 |
| 4 | English Interview |
Living
Living & Commute Recommendations
School bus route information is available for this school.
View School Bus Route
| # | Estate | Best Commute | Commute Time | Distance | Overall Score |
|---|---|---|---|---|---|
| Loading... | |||||
Note: Monthly rent/total price are estimates based on government RVD monthly residential averages by area and size, for school-living decisions only.
-
FAQ
Y7Enrollment 是每 Year Sep1 日 Start 接受 Application,9.30DeadlineApplication。所 Yes Grade 的插班 Application 都 No Deadline 日期,全 Year 都接受 Application。
Y7 中央 Application 的面试笔试时间为 Current Year Nov,插班的面试笔试时间则取决于 Application 人的优先次序,排队时间介于半 Year 到一 Year。