
Shatin Pui Ying College
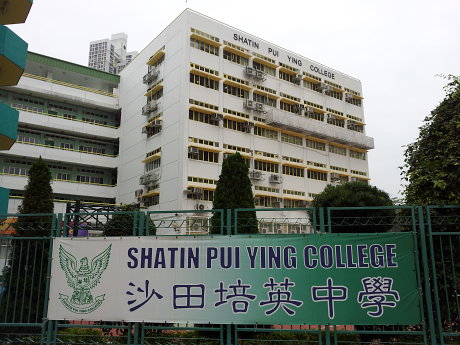
Shatin Pui Ying College
- PYC
沙田培英中学是位于香港沙田禾𪨶邨,于1978年建校[2],与沙田苏浙公学为邻,为一间知名的第一组别基督教英文中学。全校共25班,包括中四五班、中一至中三及中五至中六各四班。
Overview
School Info
Band
Band 1a
School Gender
Co-ed
School Net
School Net St
Curriculum Type
ProfileType
Aided
直升安排
N/A
Curriculum Features
Hong Kong本地→DSE
Classes & Students
Age Group
12.31
Grade Setup
G7 - G12(S1 - S6)
Classes Count
4
Teaching Language
Teaching Language
English
Chinese Characters
Traditional Chinese
Religion
Religion
Christianityity
Founded
1978
费用情况
Annual Tuition
$200
Other
Boarding Service
不提供寄宿
Entrance Exam
Chinese/English/Math Paper / English Interview / Cantonese Interview
Application Info
Minimum Application Grade
S2
Maximum Application Grade
S4
Eligible Application Grades
S2 / S3 / S4
Application Method
Online Application
Transfer Application Opens
2025/5/1
Transfer Application Deadline
2025/5/30
Useful Links
Contact
Phone
(852) 2691 7217 / 2691 7217
Email
info@pyc.edu.hk
Address
New Territories Sha Tin 区禾輋邨丰顺街 9 号
Map Location
Sha Tin培英Secondary
Fees
Fee Information
| Grade | School Level | Age | Fees | Stage |
|---|---|---|---|---|
| G7 | S1 | 12 | $200 | 中一 |
| G8 | S2 | 13 | $200 | 中二 |
| G9 | S3 | 14 | $200 | 中三 |
| G10 | S4 | 15 | $400 | 中四 |
| G11 | S5 | 16 | $400 | 中五 |
| G12 | S6 | 17 | $400 | 中六 |
Secondary S1 - S3$200
HKDSE
Secondary S4 - S6$400
HKDSE
Sources

×
1 / 1
Exam
DSE Ranking
Rank 32 / 311
Higher Ranked
- #30 Ccc Kei Yuen College
- #31 Valtorta College
Lower Ranked
DSE Overview
| Metrics | 2025 | 2024 | 2023 | Change |
|---|---|---|---|---|
| Key Metrics | ||||
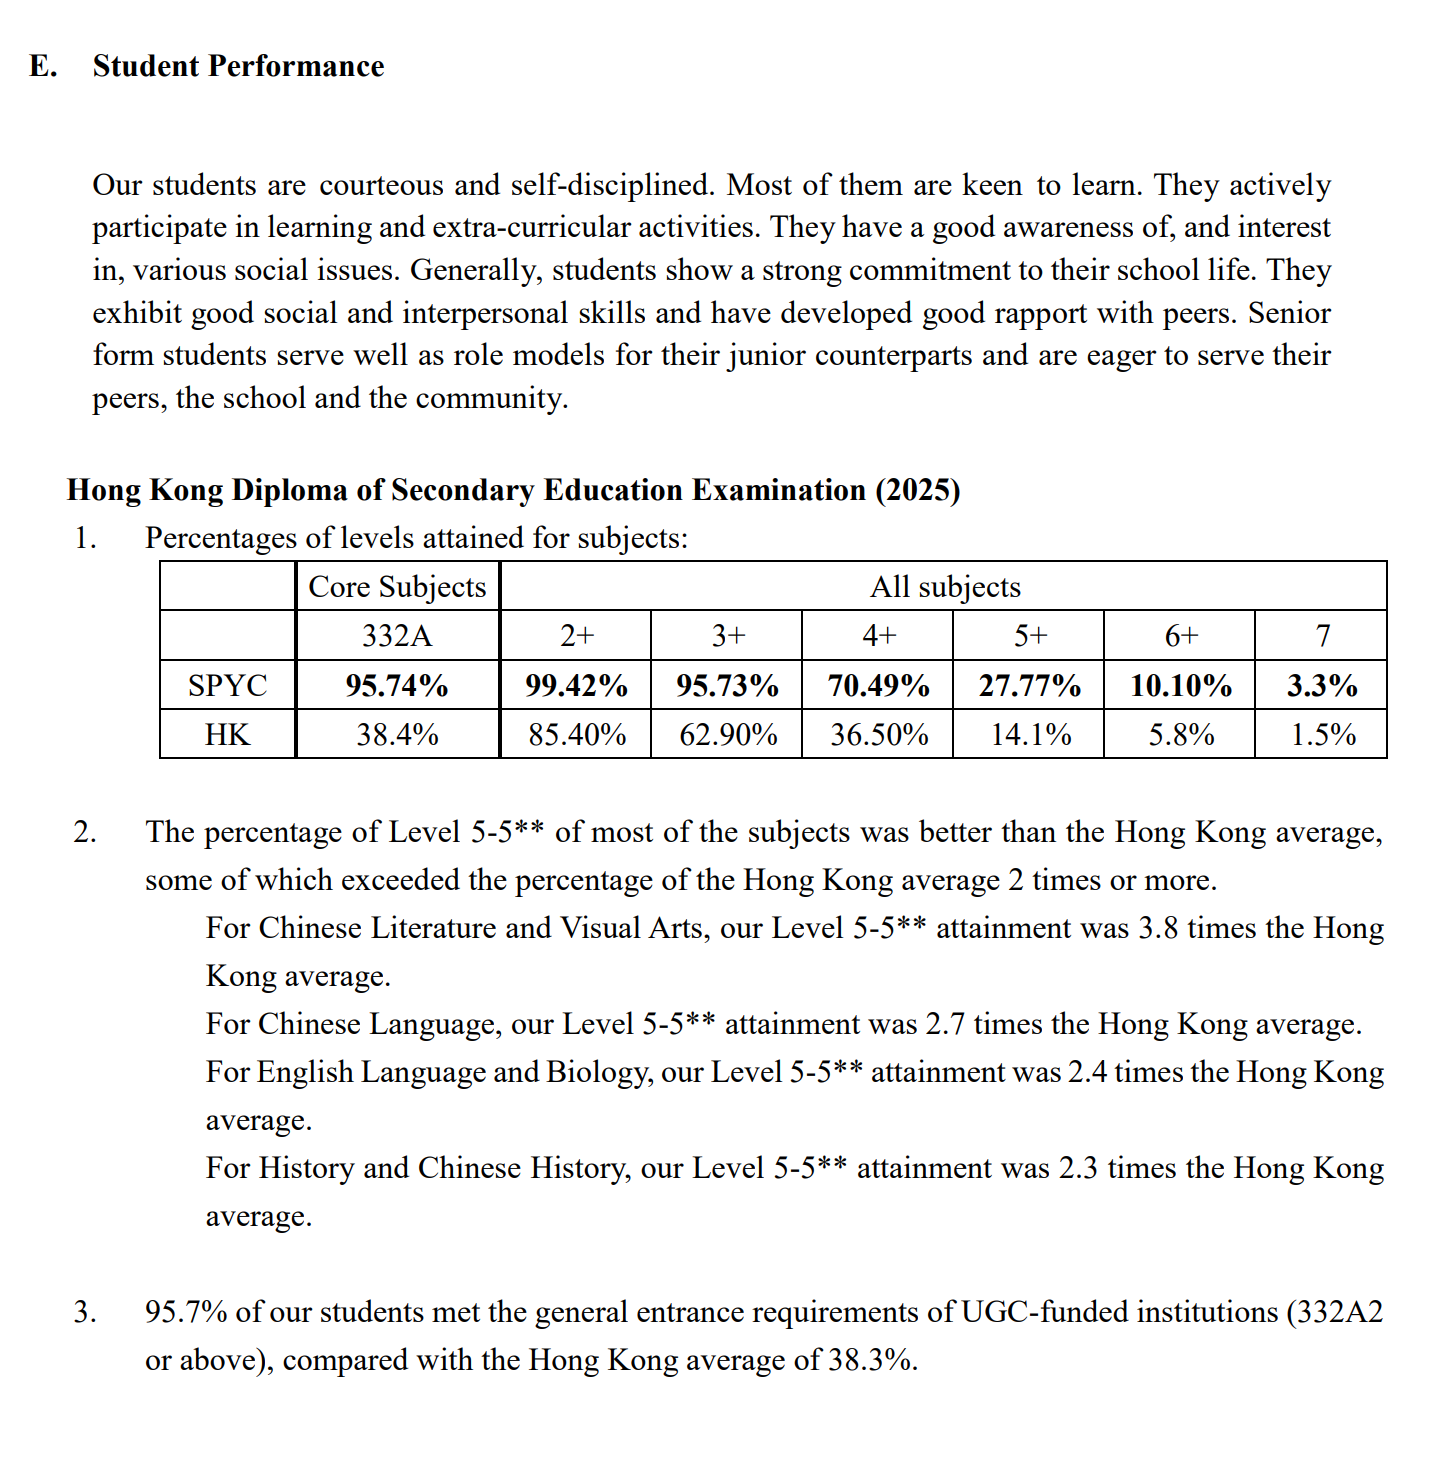
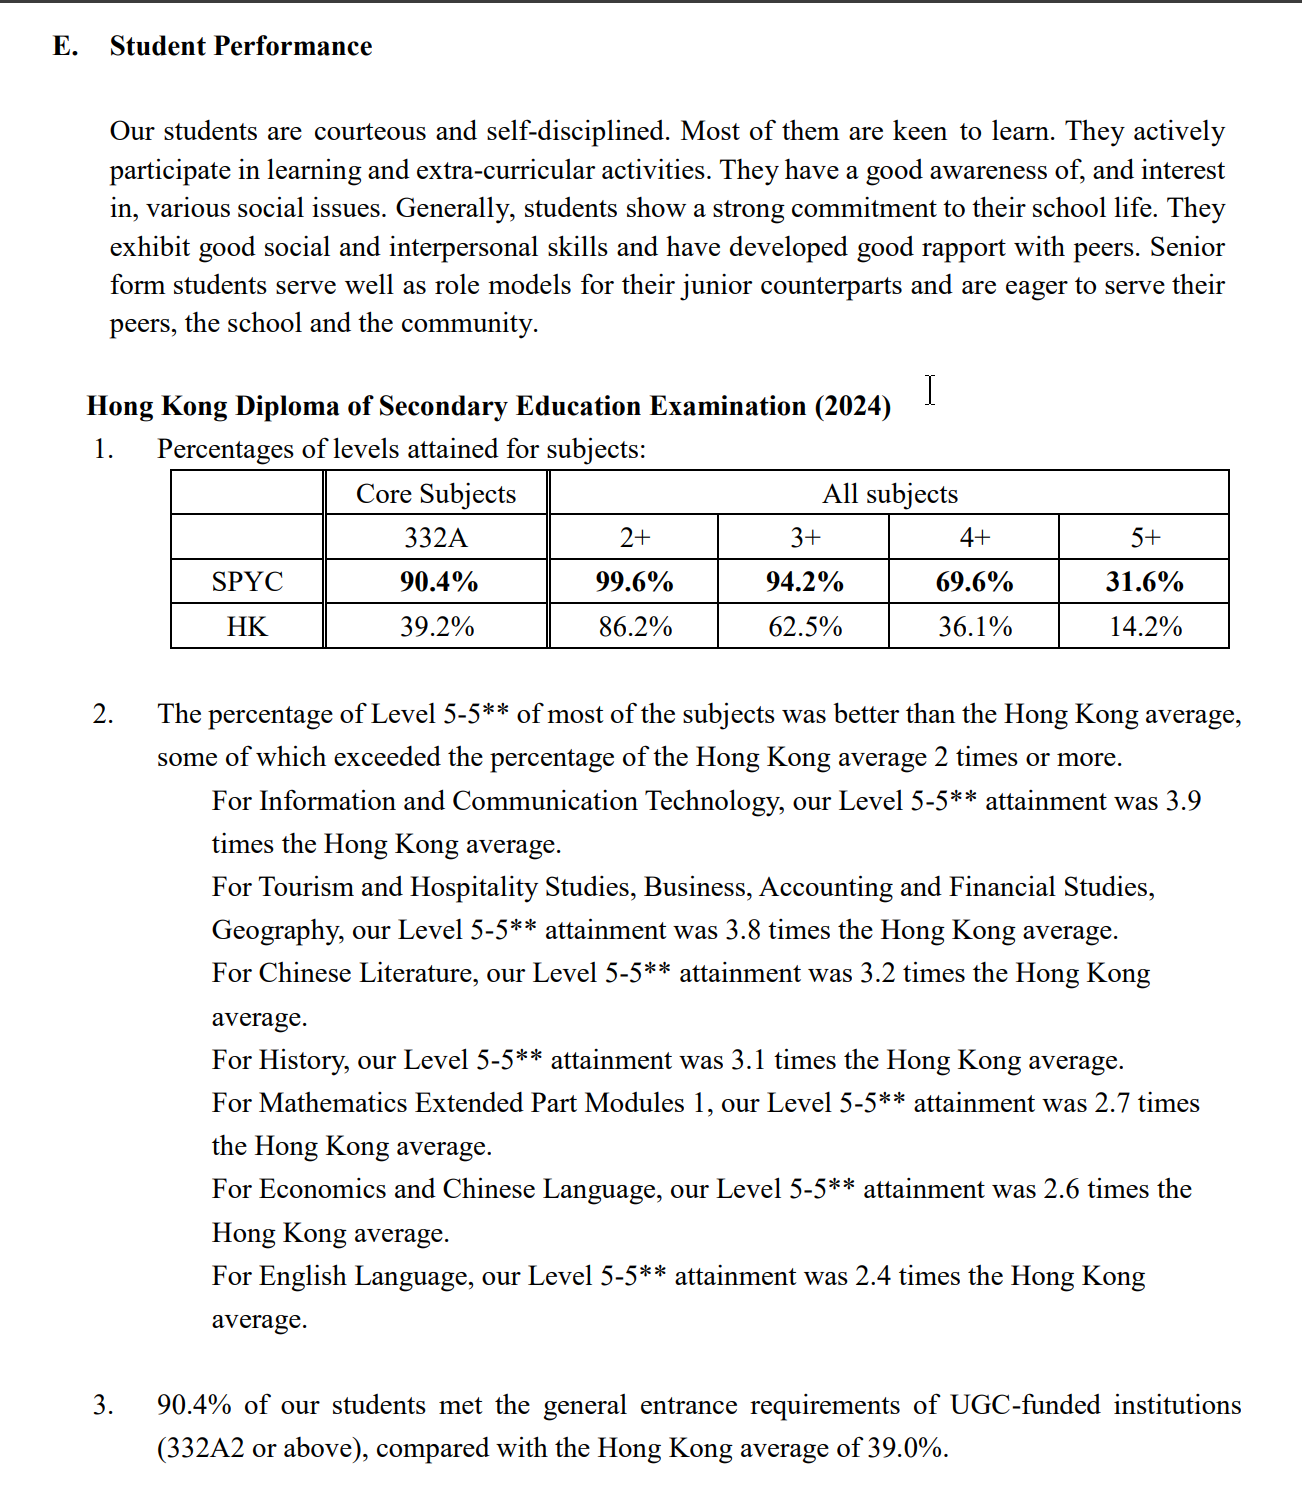
| 332A (Universities门槛) | 95.7% | 90.4% | 92.7% | ▲ 5.3% |
| 332A Notes | 332A | 332A | 3322 | - |
| Level 5+ (优秀) | ||||
| Total 5+ | 27.8% | 31.6% | 29.0% | ▼ 3.8% |
| Total 5* | 10.1% | - | - | - |
| CEM 5+ (主科) | - | 31.6% | - | - |
| Level 4+ (良好) | ||||
| Total 4+ | 70.5% | 69.6% | 71.5% | ▲ 0.9% |
| Level 3+ (及格) | ||||
| Total 3+ | 95.7% | 94.2% | 93.2% | ▲ 1.5% |
| Level 2+ (基础) | ||||
| Total 2+ | 99.4% | 99.6% | 99.2% | ▼ 0.2% |
| 人数 | ||||
| DSE Candidates | 95 | 93 | 80 | ▲ 2 |
Sources
×
1 / 1
Placement
University Placement Analysis
| Placement Destinations | 2025Year | 2024Year | Change |
|---|---|---|---|
| Hong KongTop 3 Rate | 37.5% | 44.8% | ▼ 7.3% |
| Hong KongTop 4 Rate | 48.1% | 40.1% | ▲ 8.0% |
| Hong KongTop 5 Rate | 58.6% | 51.5% | ▲ 7.1% |
| Hong KongTop 3 Rate | 76.6% | 64.1% | ▲ 12.5% |
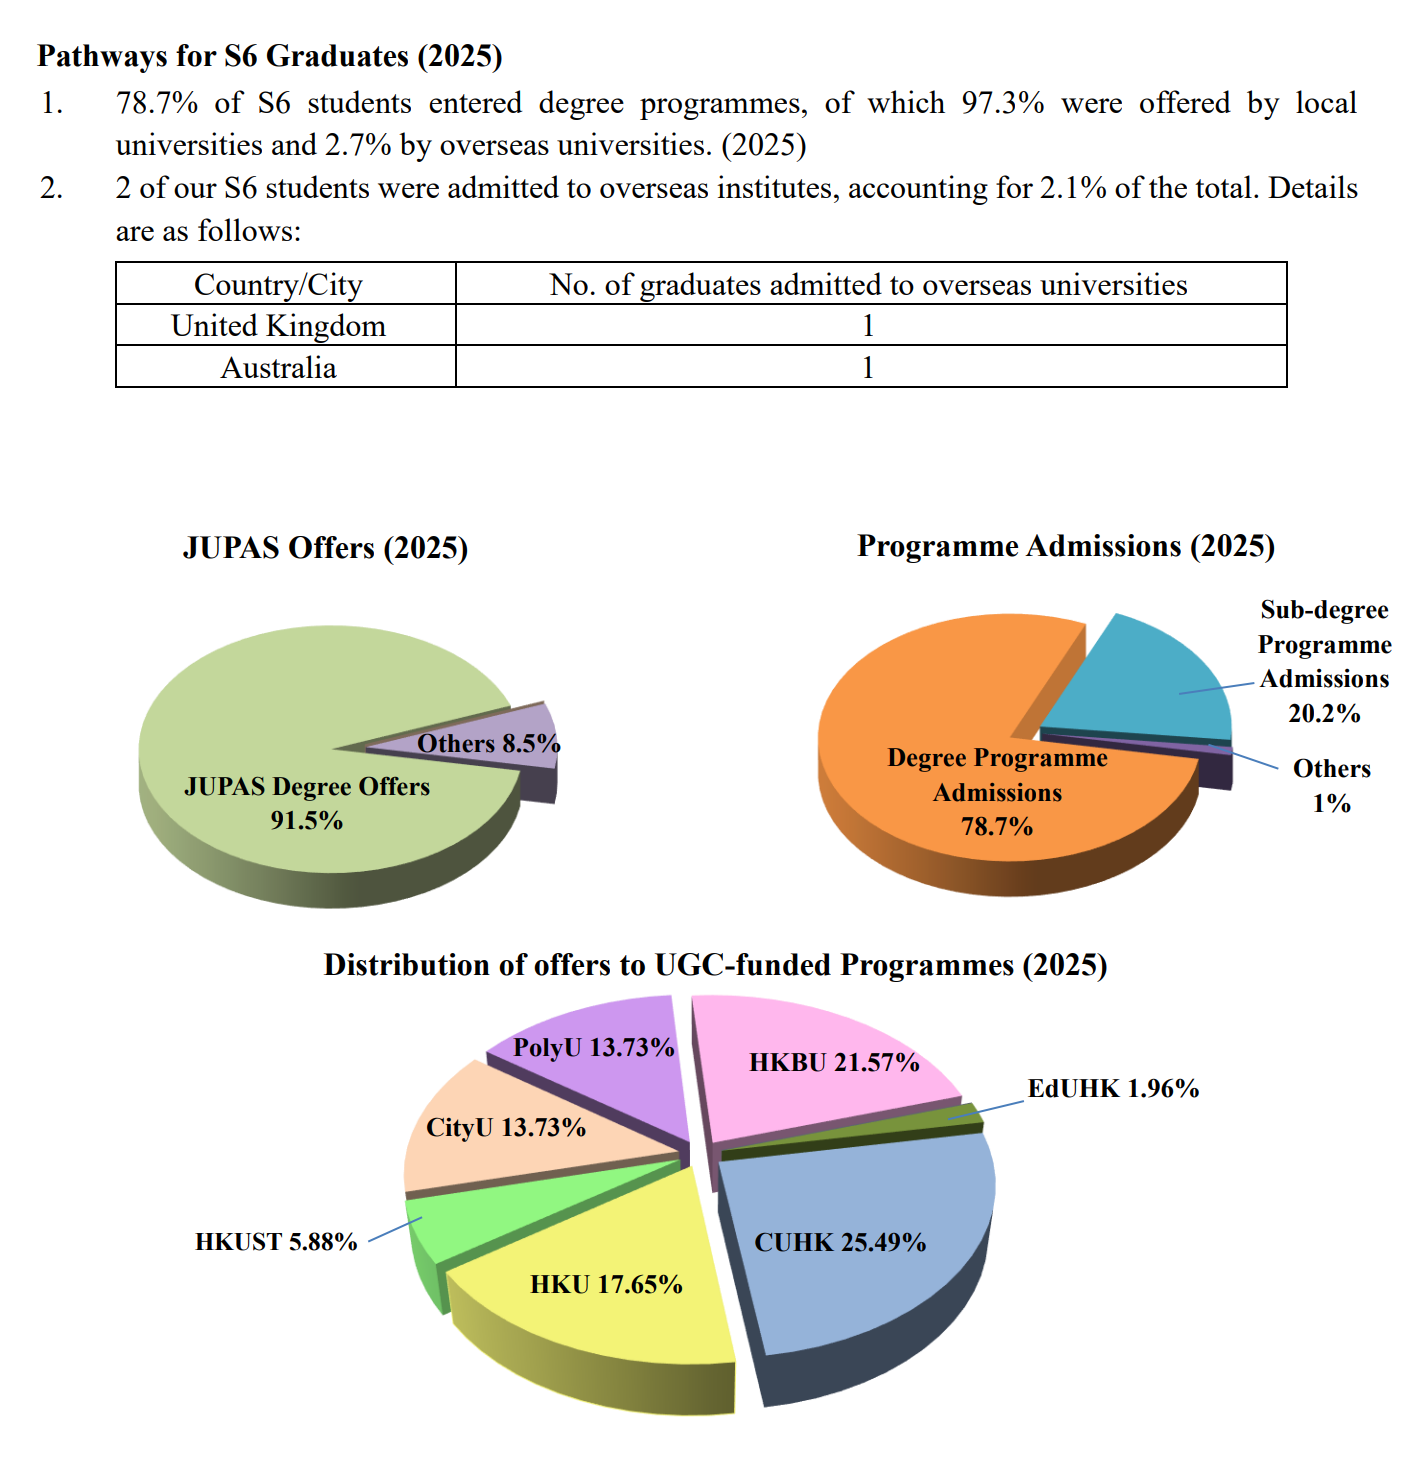
| Bachelor and Associate Degree Rate | 78.7% | 89.4% | ▼ 10.7% |
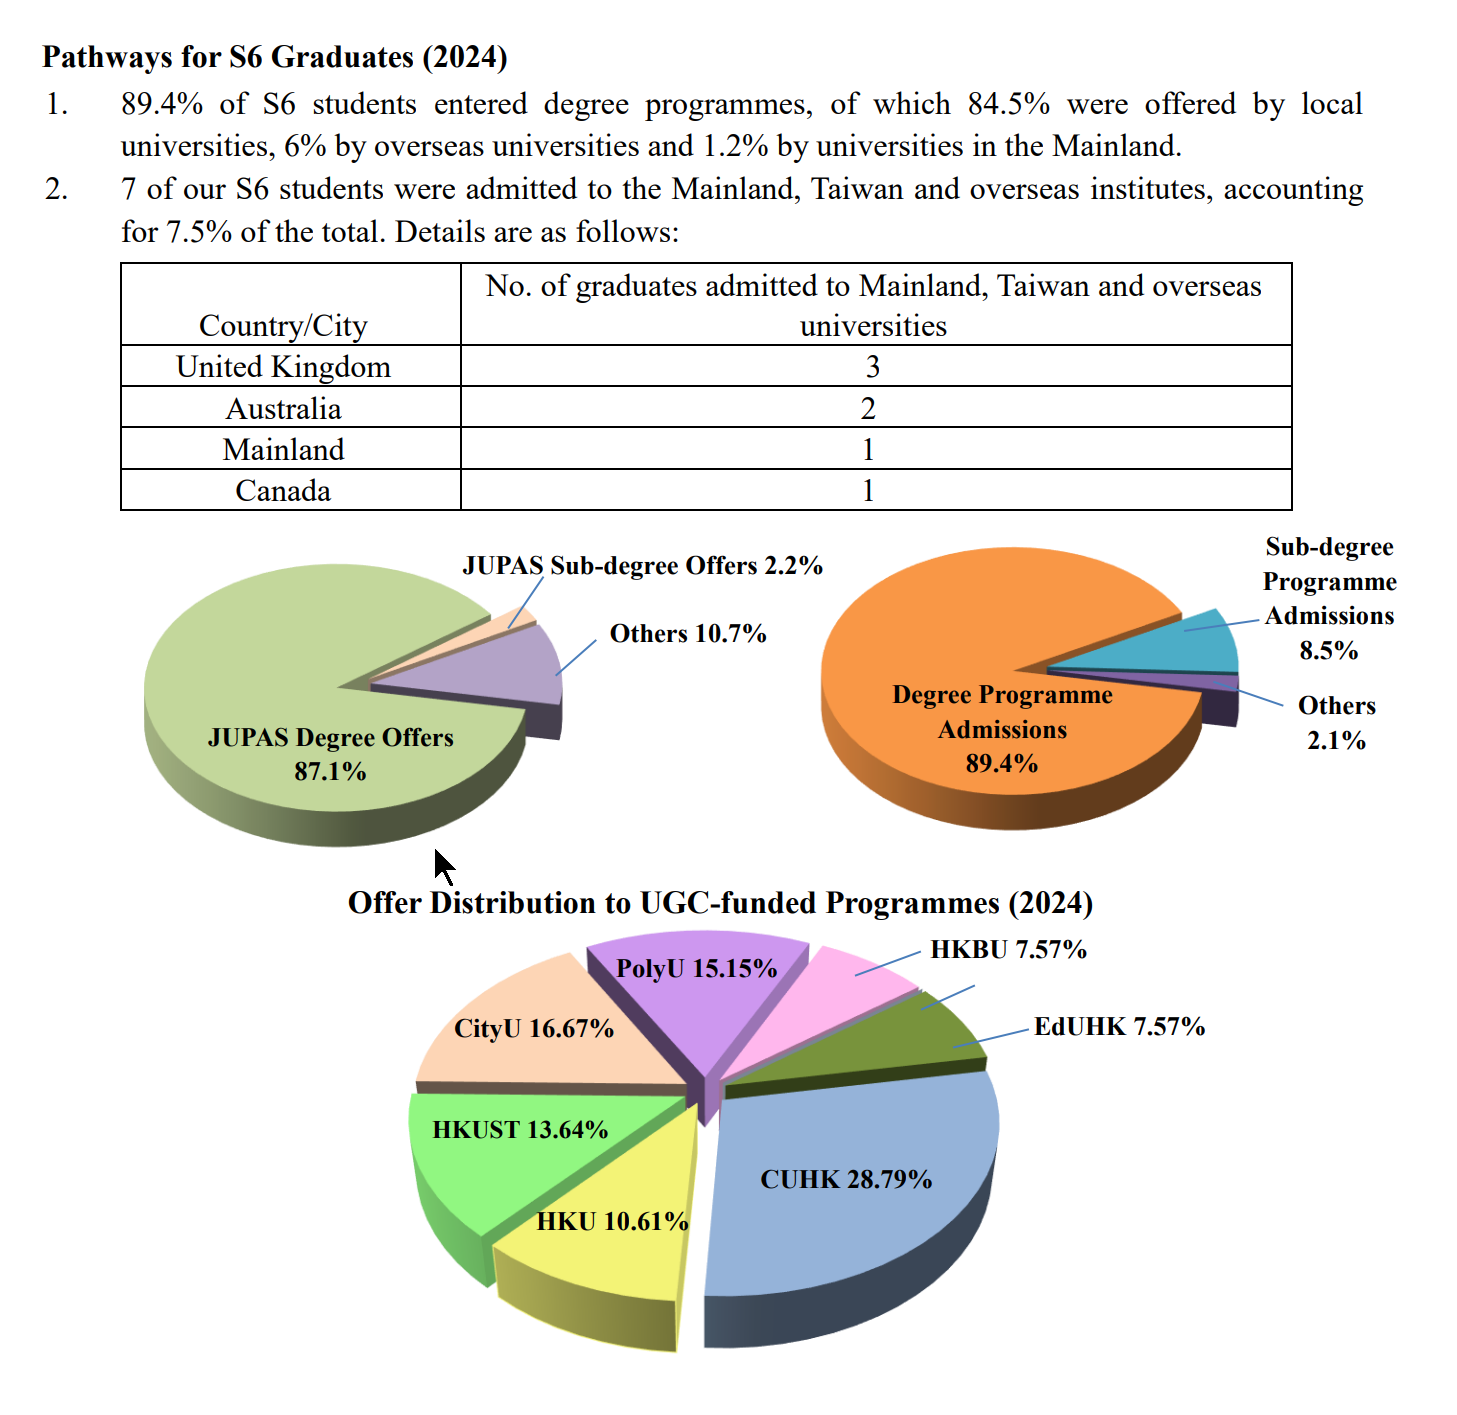
| 总本科率(本地+Overseas) | 78.7% | 87.1% | ▼ 8.4% |
| Hong Kong本地本科率 | 76.6% | 84.5% | ▼ 7.9% |
| Overseas本科率 | 2.1% | 7.5% | ▼ 5.4% |
| 副学士/Higher Diploma Rate | 20.2% | 8.5% | ▲ 11.7% |
| Progression Rate | 94.2% | - |
2025 University Tier Analysis
| University Tier | 2025Enrollment25Enrollment | 2025Enrollment%25% | 2025EnrollmentCumulative%25Cumulative | 2024Enrollment24Enrollment | 2024Enrollment%24% | 2024EnrollmentCumulative%24Cumulative | ΔOffers%Δ% |
|---|---|---|---|---|---|---|---|
| Total Students | 95 | 100.0% | - | 93 | 100.0% | - | - |
| HK Top 3 | 36 | 37.9% | 37.9% | 37 | 39.8% | 39.8% | -1.9% |
| HK Top 4 | 10 | 10.5% | 48.4% | 11 | 11.8% | 51.6% | -1.3% |
| HK Top 5 | 10 | 10.5% | 58.9% | 12 | 12.9% | 64.5% | -2.4% |
Detailed University Placement Results
| University Name | 25 Matriculations25 Matric. | 25 Matric. %25 % | 24 Matriculations24 Matric. | 24 Matric. %24 % | QS | US | THE | Country |
|---|---|---|---|---|---|---|---|---|
The University of Hong Kong | 13 | 13.7% | 7 | 7.5% | 11 | - | - | 中国Hong Kong |
The Chinese University of Hong Kong | 19 | 20.0% | 20 | 21.5% | 32 | - | 43 | 中国Hong Kong |
The Hong Kong University of Science and Technology | 4 | 4.2% | 10 | 10.8% | 44 | - | 60 | 中国Hong Kong |
The Hong Kong Polytechnic University | 10 | 10.5% | 11 | 11.8% | 54 | - | 80 | 中国Hong Kong |
City University of Hong Kong | 10 | 10.5% | 12 | 12.9% | 63 | - | 73 | 中国Hong Kong |
Hong Kong Baptist University | 16 | 16.8% | 5 | 5.4% | - | - | - | 中国Hong Kong |
The Education University of Hong Kong | 1 | 1.1% | 5 | 5.4% | - | - | - | 中国Hong Kong |
Overseas Universities | 2 | 2.1% | 7 | 7.5% | - | - | - | |
Associate Degree Program | 19 | 20.0% | 8 | 8.6% | - | - | - | 副学士/预科 |
Others/National Service | 1 | 1.1% | 8 | 8.6% | - | - | - | Other |
Data Notes
Matriculation counts students who finally enroll at a university. Since each student enrolls in only one university, total matriculations usually do not exceed total graduates.
Offer counts admission offers received by students. A student may receive multiple offers, so total offers are usually higher than total graduates.
| University Name | 25 Matriculations25 Matric. | 25 Matric. %25 % | 24 Matriculations24 Matric. | 24 Matric. %24 % | QS | US | THE |
|---|---|---|---|---|---|---|---|
The University of Hong Kong | 13 | 13.7% | 7 | 7.5% | 11 | - | - |
The Chinese University of Hong Kong | 19 | 20.0% | 20 | 21.5% | 32 | - | 43 |
The Hong Kong University of Science and Technology | 4 | 4.2% | 10 | 10.8% | 44 | - | 60 |
The Hong Kong Polytechnic University | 10 | 10.5% | 11 | 11.8% | 54 | - | 80 |
City University of Hong Kong | 10 | 10.5% | 12 | 12.9% | 63 | - | 73 |
Hong Kong Baptist University | 16 | 16.8% | 5 | 5.4% | - | - | - |
The Education University of Hong Kong | 1 | 1.1% | 5 | 5.4% | - | - | - |
Sources
×
1 / 1
Living
Living & Commute Recommendations
| # | Estate | Best Commute | Commute Time | Distance | Overall Score |
|---|---|---|---|---|---|
| Loading... | |||||
Note: Monthly rent/total price are estimates based on government RVD monthly residential averages by area and size, for school-living decisions only.
-