
S.K.H. Lam Woo Memorial Secondary School
S.K.H. Lam Woo Memorial Secondary School
- LWMSS
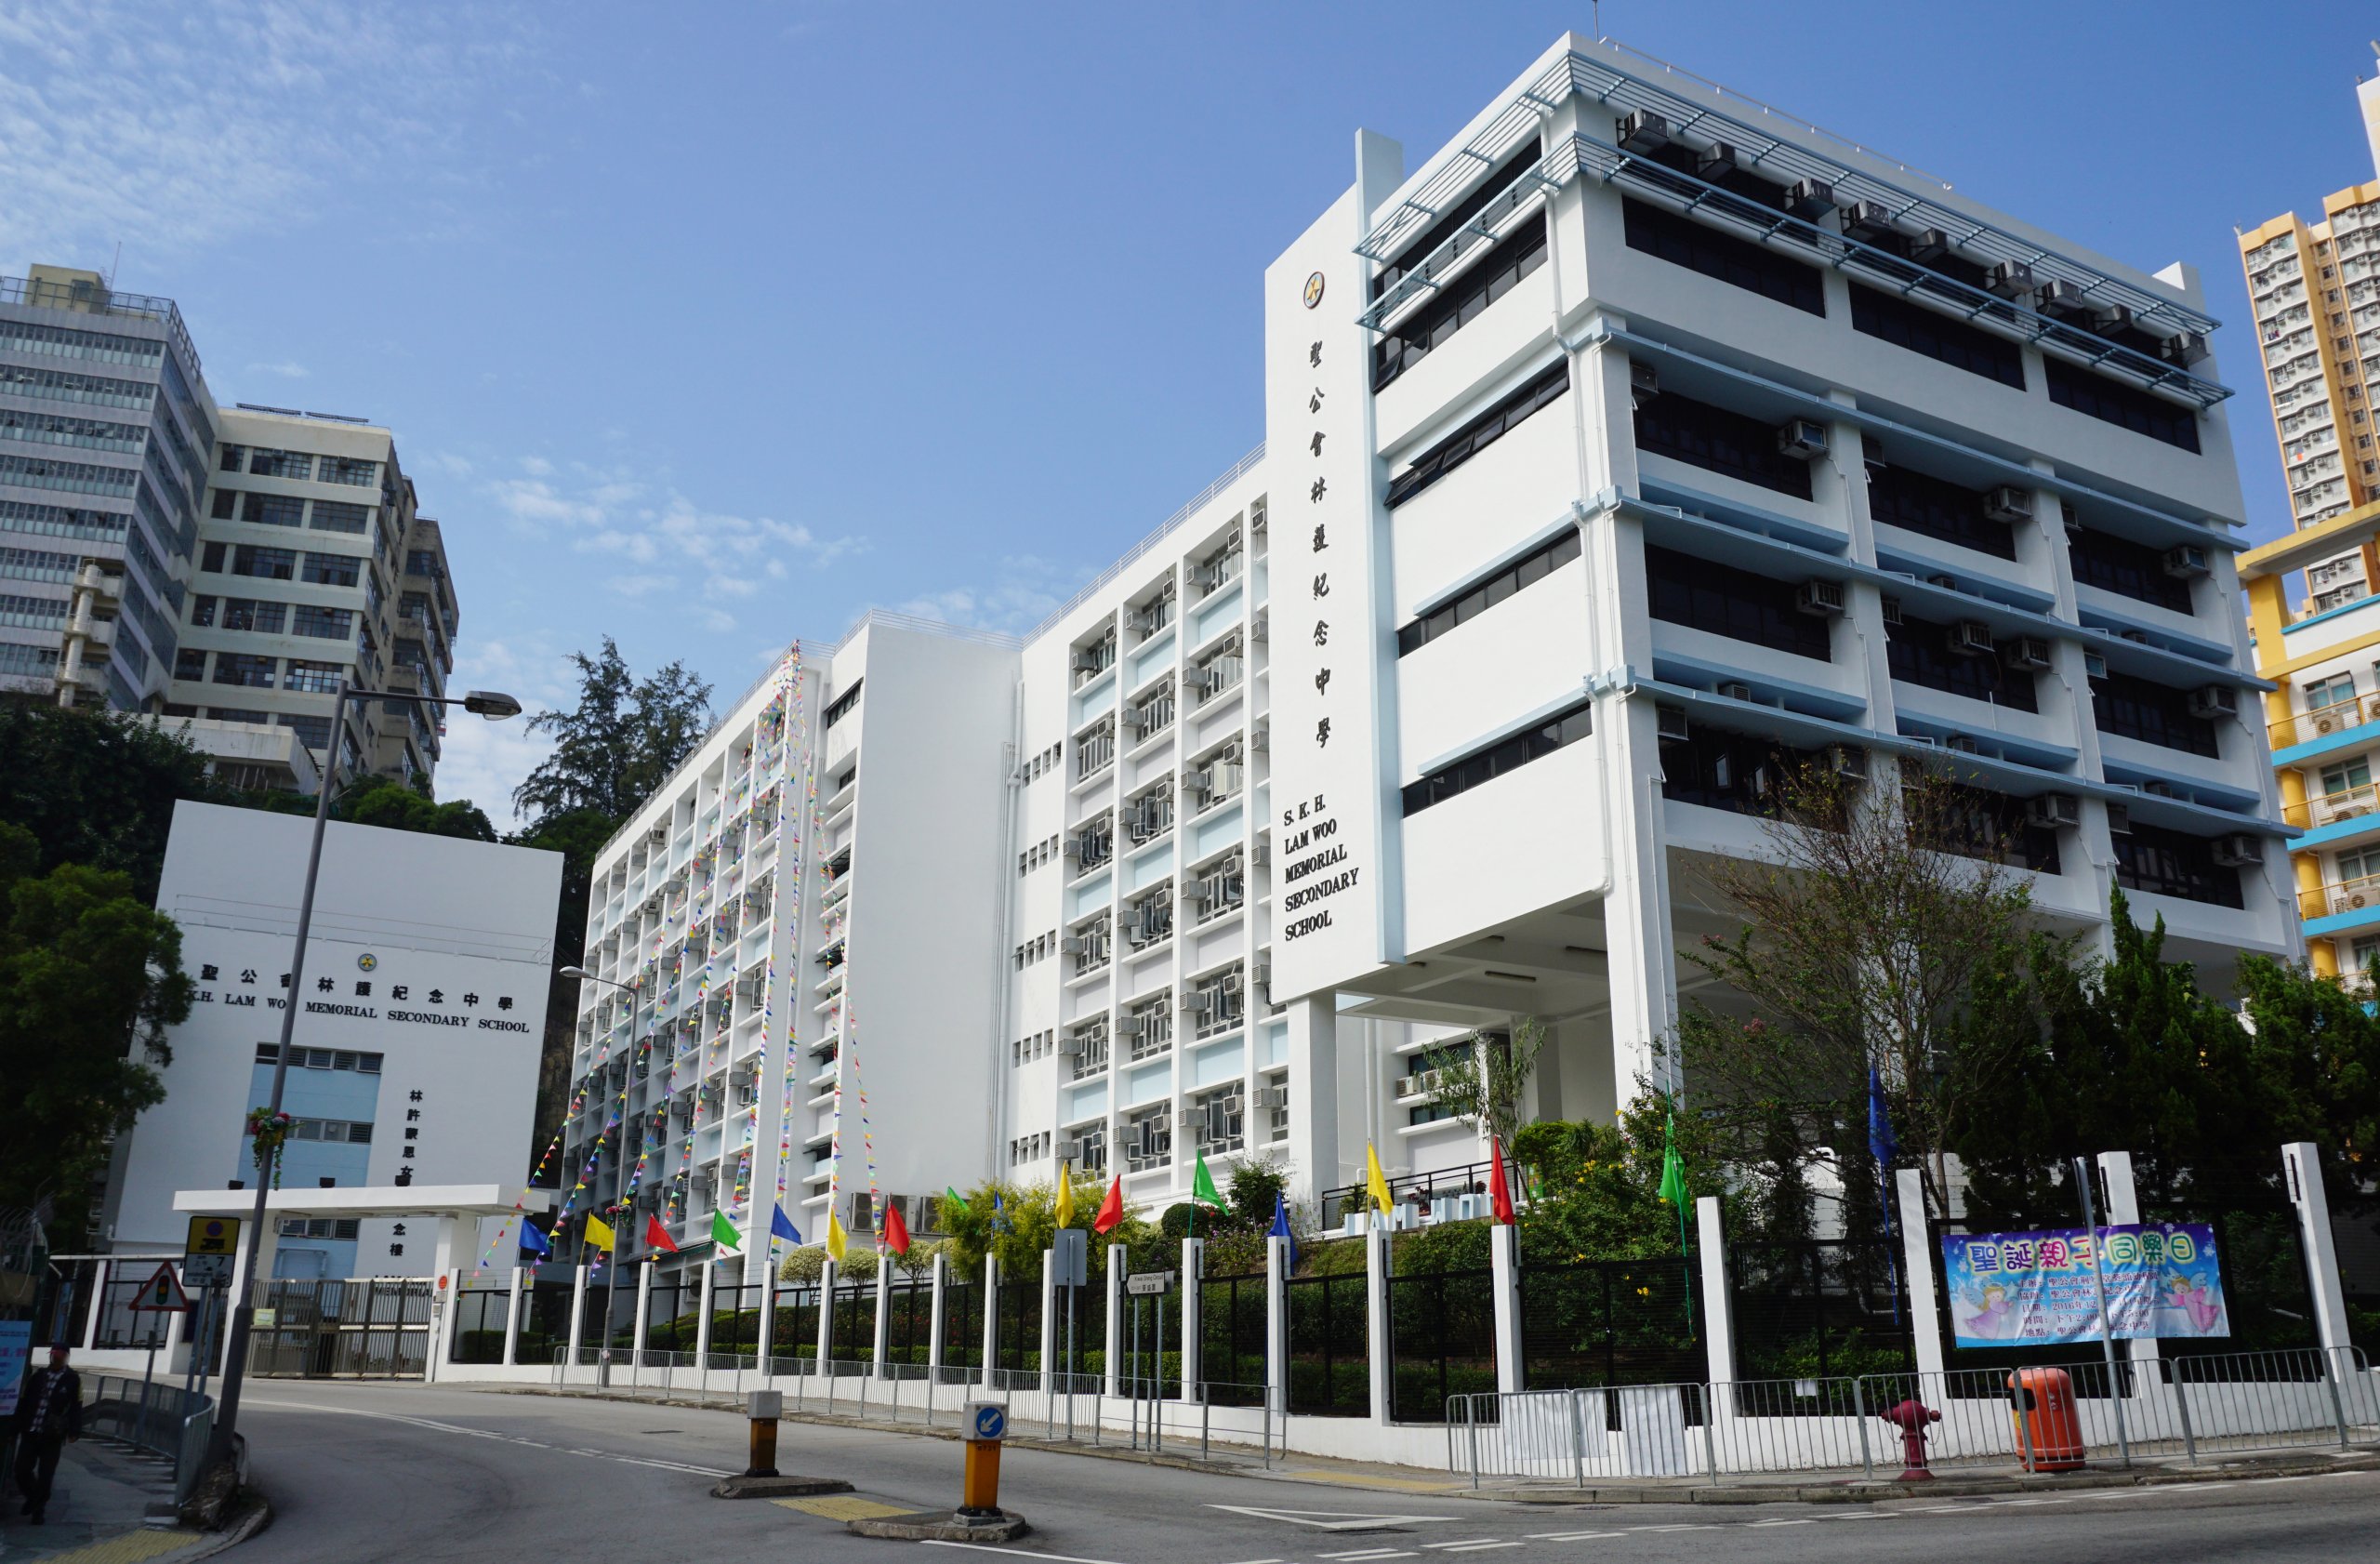
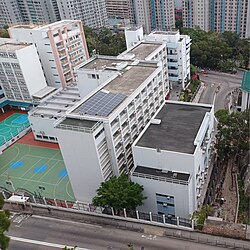
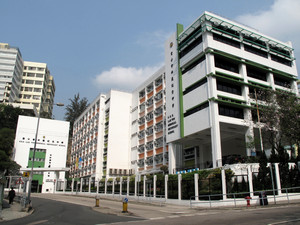
圣公会林护纪念中学(英语:S.K.H. Lam Woo Memorial Secondary School,简称林护、LWMSS)是一所位于香港新界葵涌葵盛围397号的英文津贴中学,占地8400平方米,邻近港铁葵兴站,为一所英文中学。
在历届香港中学会考及香港中学文凭考试,圣公会林护纪念中学是产生最多会考“10A状元”及文凭试“7科5**状元”(在甲类科目中至少3个选修科及4个核心科获得5**成绩)的学校之一,截至2024年,共有3位,包括2位会考“10A状元”及1名文凭试“7科5**状元”,排名全港第17。
Overview
School Info
Band
Band 1a
School Gender
Co-ed
School Net
School Net Kwaitsing
Primary联系
S.K.H. Yan Laap Memorial Primary School / Skh Yan Laap Primary School
Curriculum Type
ProfileType
Aided
直升安排
Through-train
Curriculum Features
Hong Kong本地→DSE
Classes & Students
Age Group
12.31
Grade Setup
G7 - G12(S1 - S6)
Classes Count
4
Teaching Language
Teaching Language
English
Chinese Characters
Traditional Chinese
Religion
Religion
Christianityity
Founded
1970
费用情况
Annual Tuition
-
Other
Boarding Service
不提供寄宿
Entrance Exam
Chinese/English/Math Paper / English Interview / Cantonese Interview
Application Info
Minimum Application Grade
S2
Maximum Application Grade
S4
Eligible Application Grades
S2 / S3 / S4
Application Method
Online Application
Transfer Application Opens
2025/3/3
Transfer Application Deadline
2025/6/13
School Documents
Useful Links
Contact
Phone
(852) 2420 8893 / 2420 8893
Email
lamwoo@netvigator.com
Address
New Territories Kwai Tsing 区葵涌葵盛围 397 号
Map Location
聖公會林護紀念Secondary
Student Distribution
Student Enrollment Trend
Select Data Year:
| Grade | 2023-2024 | ||
|---|---|---|---|
| Students | Classes | Students / Class | |
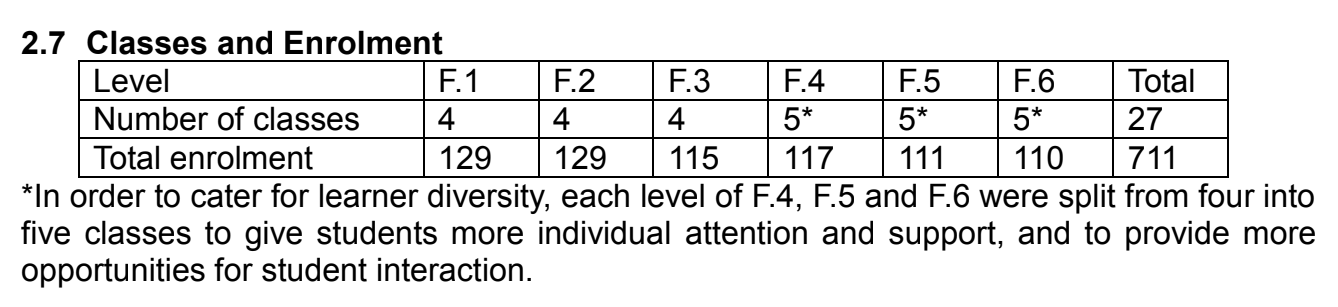
| S1 | 129 | 4 | 32.3 |
| S2 | 129 | 4 | 32.3 |
| S3 | 115 | 4 | 28.8 |
| S4 | 117 | 5 | 23.4 |
| S5 | 111 | 5 | 22.2 |
| S6 | 110 | 5 | 22 |
| Total | 711 | 27 | 26.3 |
* Δ Students = students in this grade this year − students in the lower grade last year. It indicates cohort-size change.
Sources
2023-2024 Student Distribution
×
1 / 1
Fees
Fee Information
| Grade | School Level | Age | Fees | Stage |
|---|---|---|---|---|
| G10 | S4 | 15 | $290 | 中四 |
| G11 | S5 | 16 | $290 | 中五 |
| G12 | S6 | 17 | $290 | 中六 |
Secondary S1 - S30
HKDSE
Secondary S4 - S6$290
HKDSE
Sources

×
1 / 1
Exam
DSE Ranking
Rank 18 / 309
Higher Ranked
Lower Ranked
DSE Overview
| Metrics | 2025 | 2024 | 2023 | Change |
|---|---|---|---|---|
| Key Metrics | ||||
| 332A (Universities门槛) | 91.8% | 93.6% | 98.2% | ▼ 1.8% |
| 332A Notes | 332A2 | 332A2 | 33222 | - |
| Level 5+ (优秀) | ||||
| Total 5+ | - | 48.7% | - | - |
| CEM 5+ (主科) | 35.7% | 40.0% | 43.7% | ▼ 4.3% |
| Chinese 5+ | 26.0% | 36.0% | 36.0% | ▼ 10.0% |
| English 5+ | 33.0% | 32.0% | 39.0% | ▲ 1.0% |
| 数学 5+ | 48.0% | 52.0% | 56.0% | ▼ 4.0% |
| Level 4+ (良好) | ||||
| Total 4+ | - | 76.4% | - | - |
| CEM 4+ (主科) | 76.3% | 79.7% | 82.3% | ▼ 3.4% |
| Chinese 4+ | 57.0% | 73.0% | 74.0% | ▼ 16.0% |
| English 4+ | 83.0% | 76.0% | 82.0% | ▲ 7.0% |
| 数学 4+ | 89.0% | 90.0% | 91.0% | ▼ 1.0% |
| 人数 | ||||
| DSE Candidates | 110 | 110 | 109 | - |
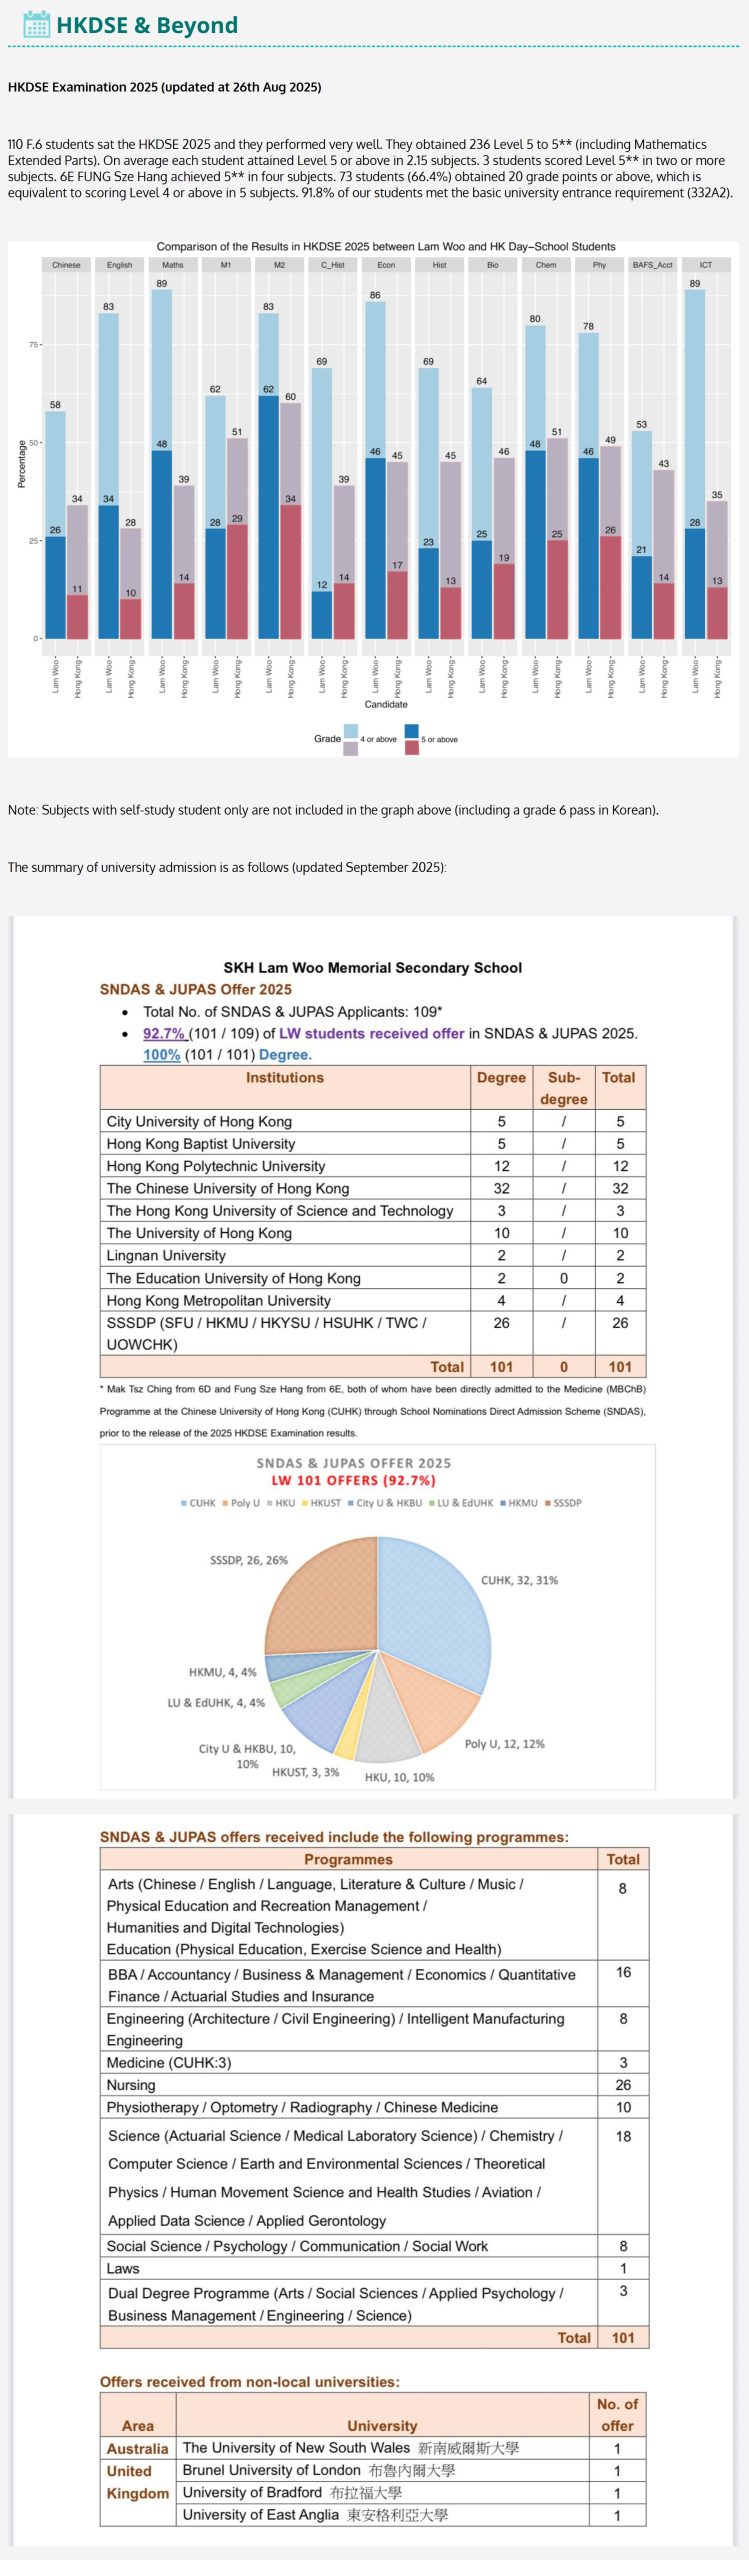
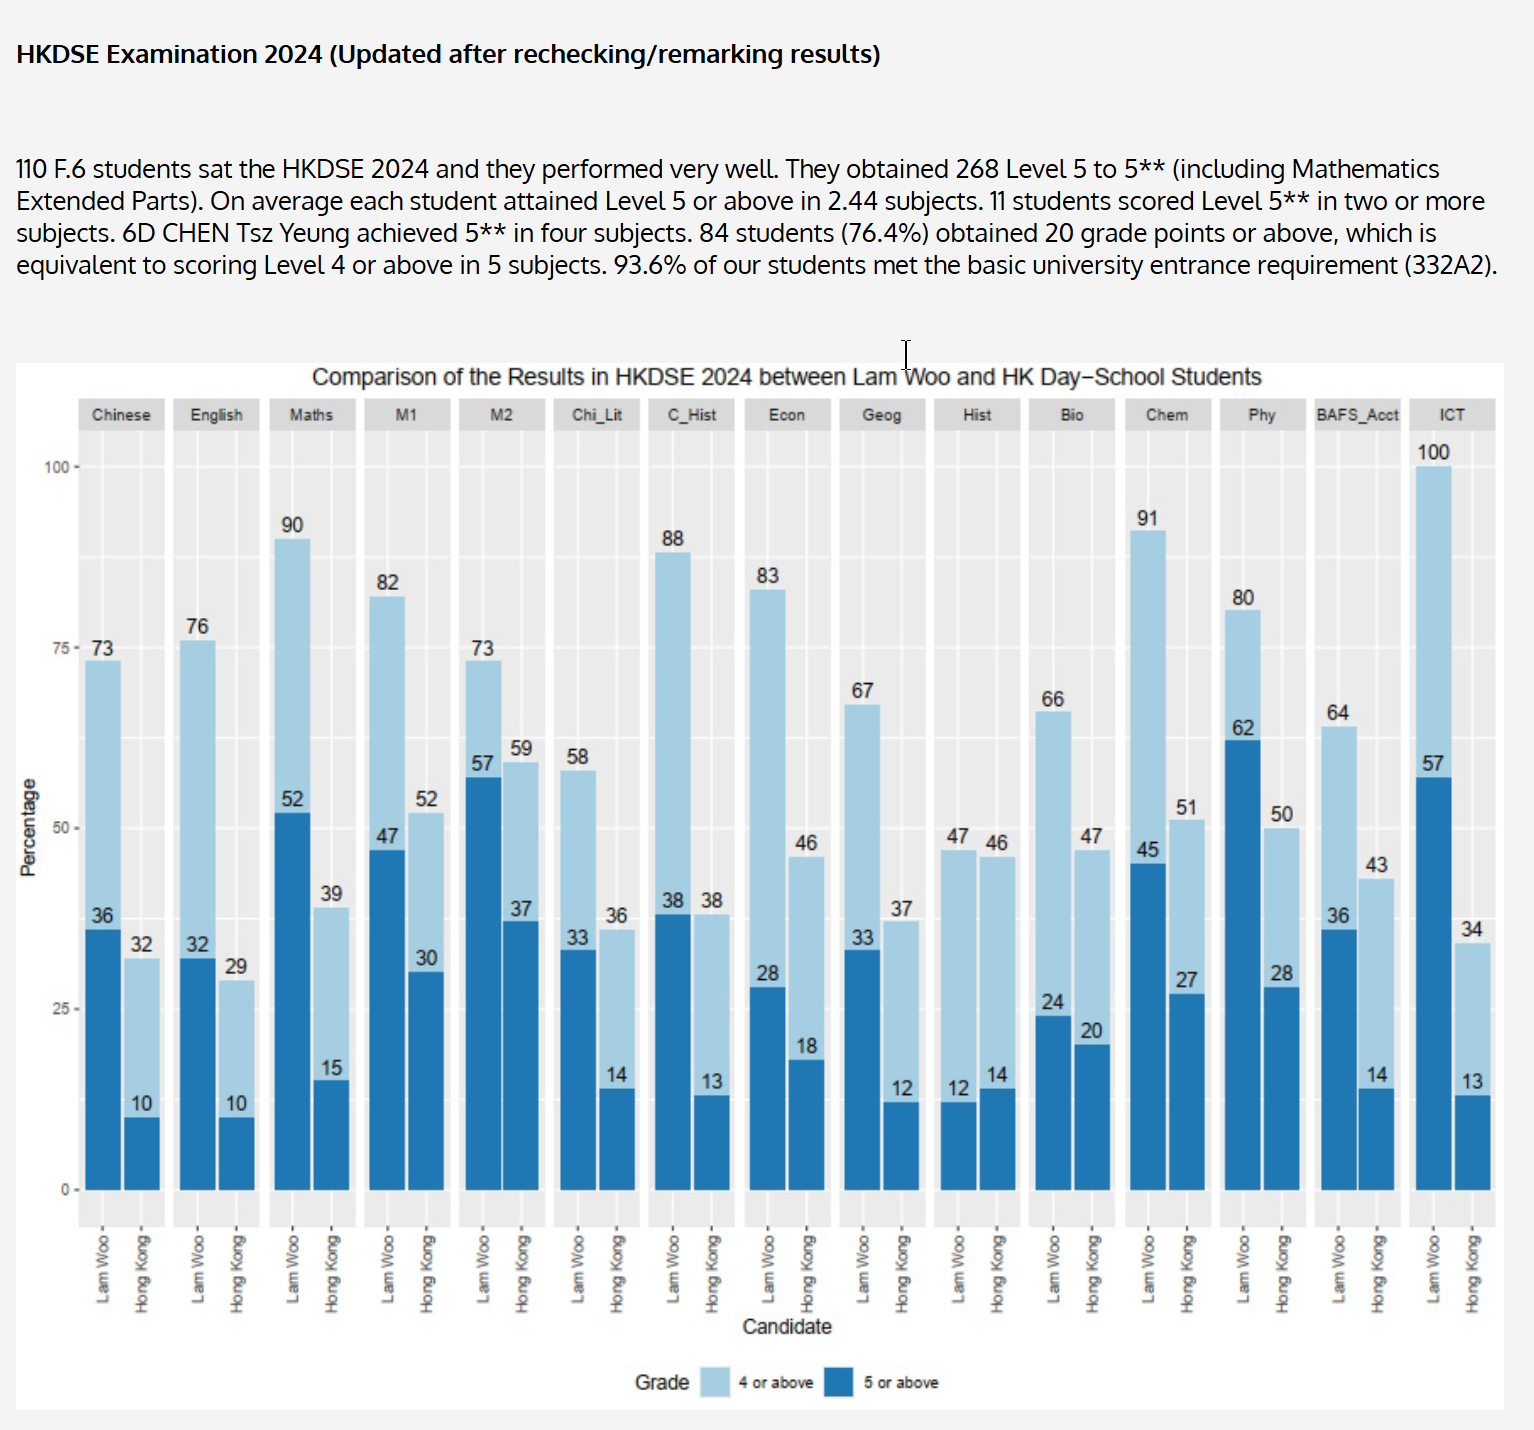
DSE Subject Results
| Subject | 2025 (%) | 2024 (%) | Change |
|---|---|---|---|
| Chinese | 26.0 | 36.0 | ▼ 10.0 |
| Chinese History | 12.0 | 38.0 | ▼ 26.0 |
| Chinese Literature | - | 33.0 | - |
| English | 34.0 | 32.0 | ▲ 2.0 |
| Compulsory Mathematics | 48.0 | 52.0 | ▼ 4.0 |
| Mathematics M1 | 28.0 | 47.0 | ▼ 19.0 |
| Mathematics M2 | 62.0 | 57.0 | ▲ 5.0 |
| Chemistry | 48.0 | 45.0 | ▲ 3.0 |
| Economics | 46.0 | 28.0 | ▲ 18.0 |
| Physics | 46.0 | 62.0 | ▼ 16.0 |
| Geography | - | 33.0 | - |
| ICT | 28.0 | 57.0 | ▼ 29.0 |
| Biology | 25.0 | 24.0 | ▲ 1.0 |
| History | 23.0 | 12.0 | ▲ 11.0 |
| BAFS Accounting | 21.0 | 36.0 | ▼ 15.0 |
| Chinese | 58.0 | 73.0 | ▼ 15.0 |
| Chinese History | 69.0 | 88.0 | ▼ 19.0 |
| Chinese Literature | - | 58.0 | - |
| English | 83.0 | 76.0 | ▲ 7.0 |
| Compulsory Mathematics | 89.0 | 90.0 | ▼ 1.0 |
| Mathematics M1 | 62.0 | 82.0 | ▼ 20.0 |
| Mathematics M2 | 83.0 | 73.0 | ▲ 10.0 |
| ICT | 89.0 | 100.0 | ▼ 11.0 |
| Economics | 86.0 | 83.0 | ▲ 3.0 |
| Chemistry | 80.0 | 91.0 | ▼ 11.0 |
| Physics | 78.0 | 80.0 | ▼ 2.0 |
| History | 69.0 | 47.0 | ▲ 22.0 |
| Geography | - | 67.0 | - |
| Biology | 64.0 | 66.0 | ▼ 2.0 |
| BAFS Accounting | 53.0 | 64.0 | ▼ 11.0 |
Sources
×
1 / 1
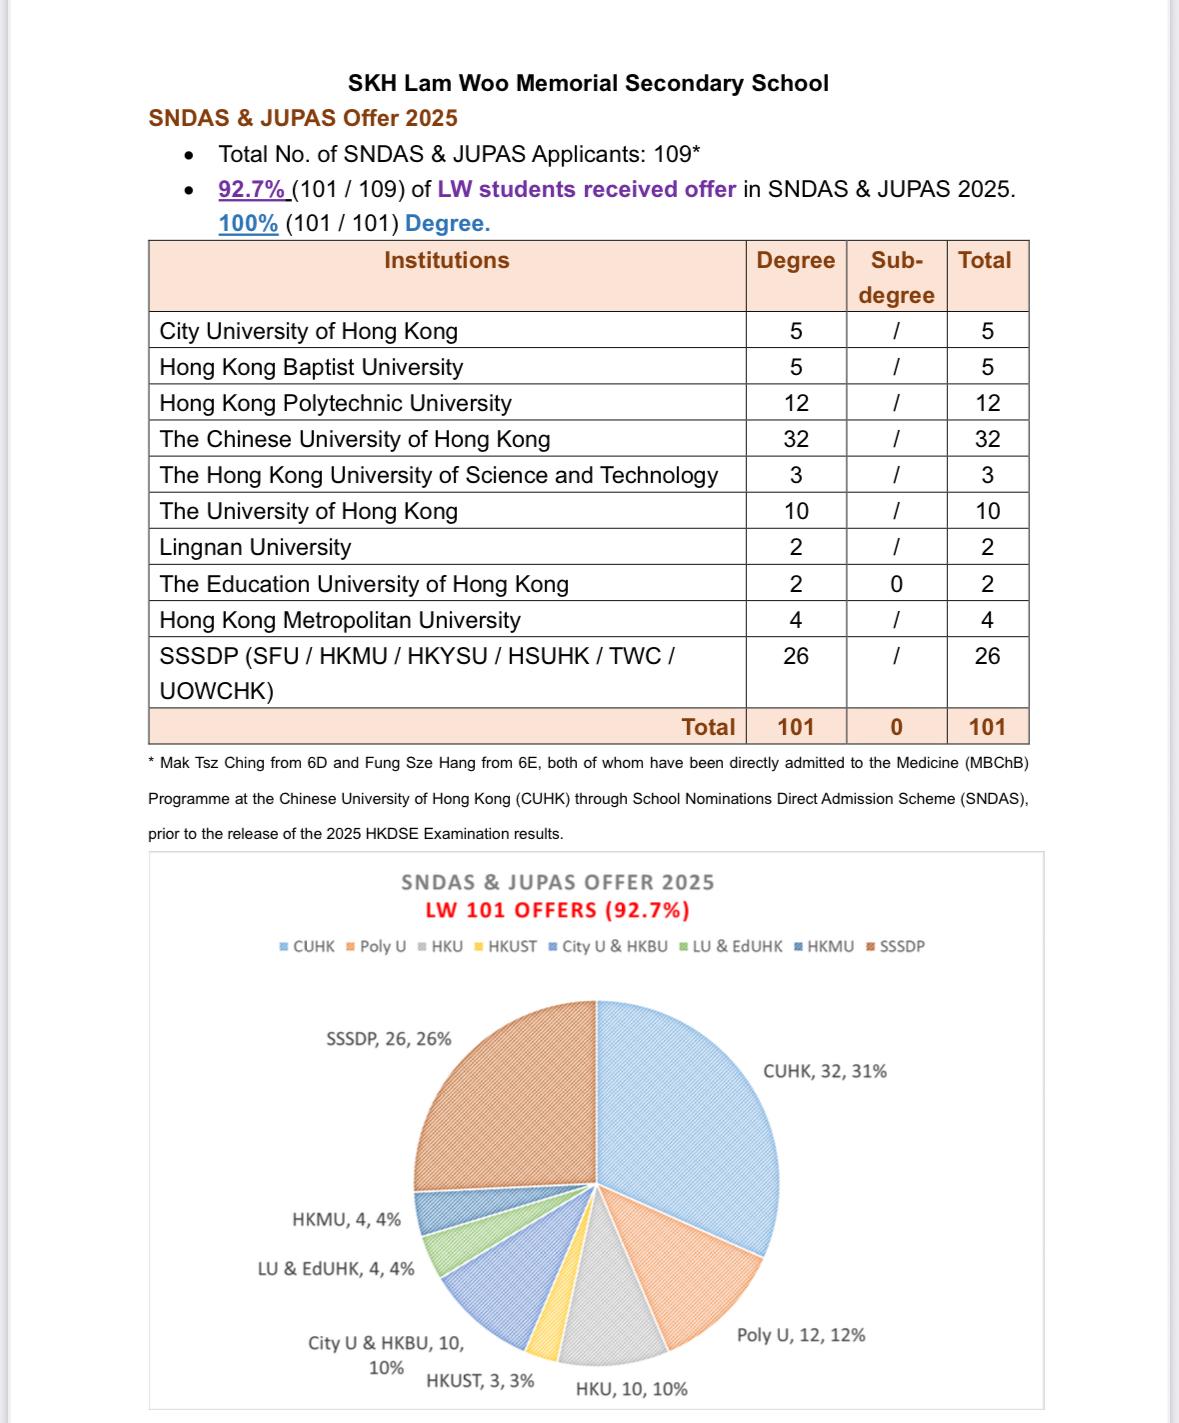
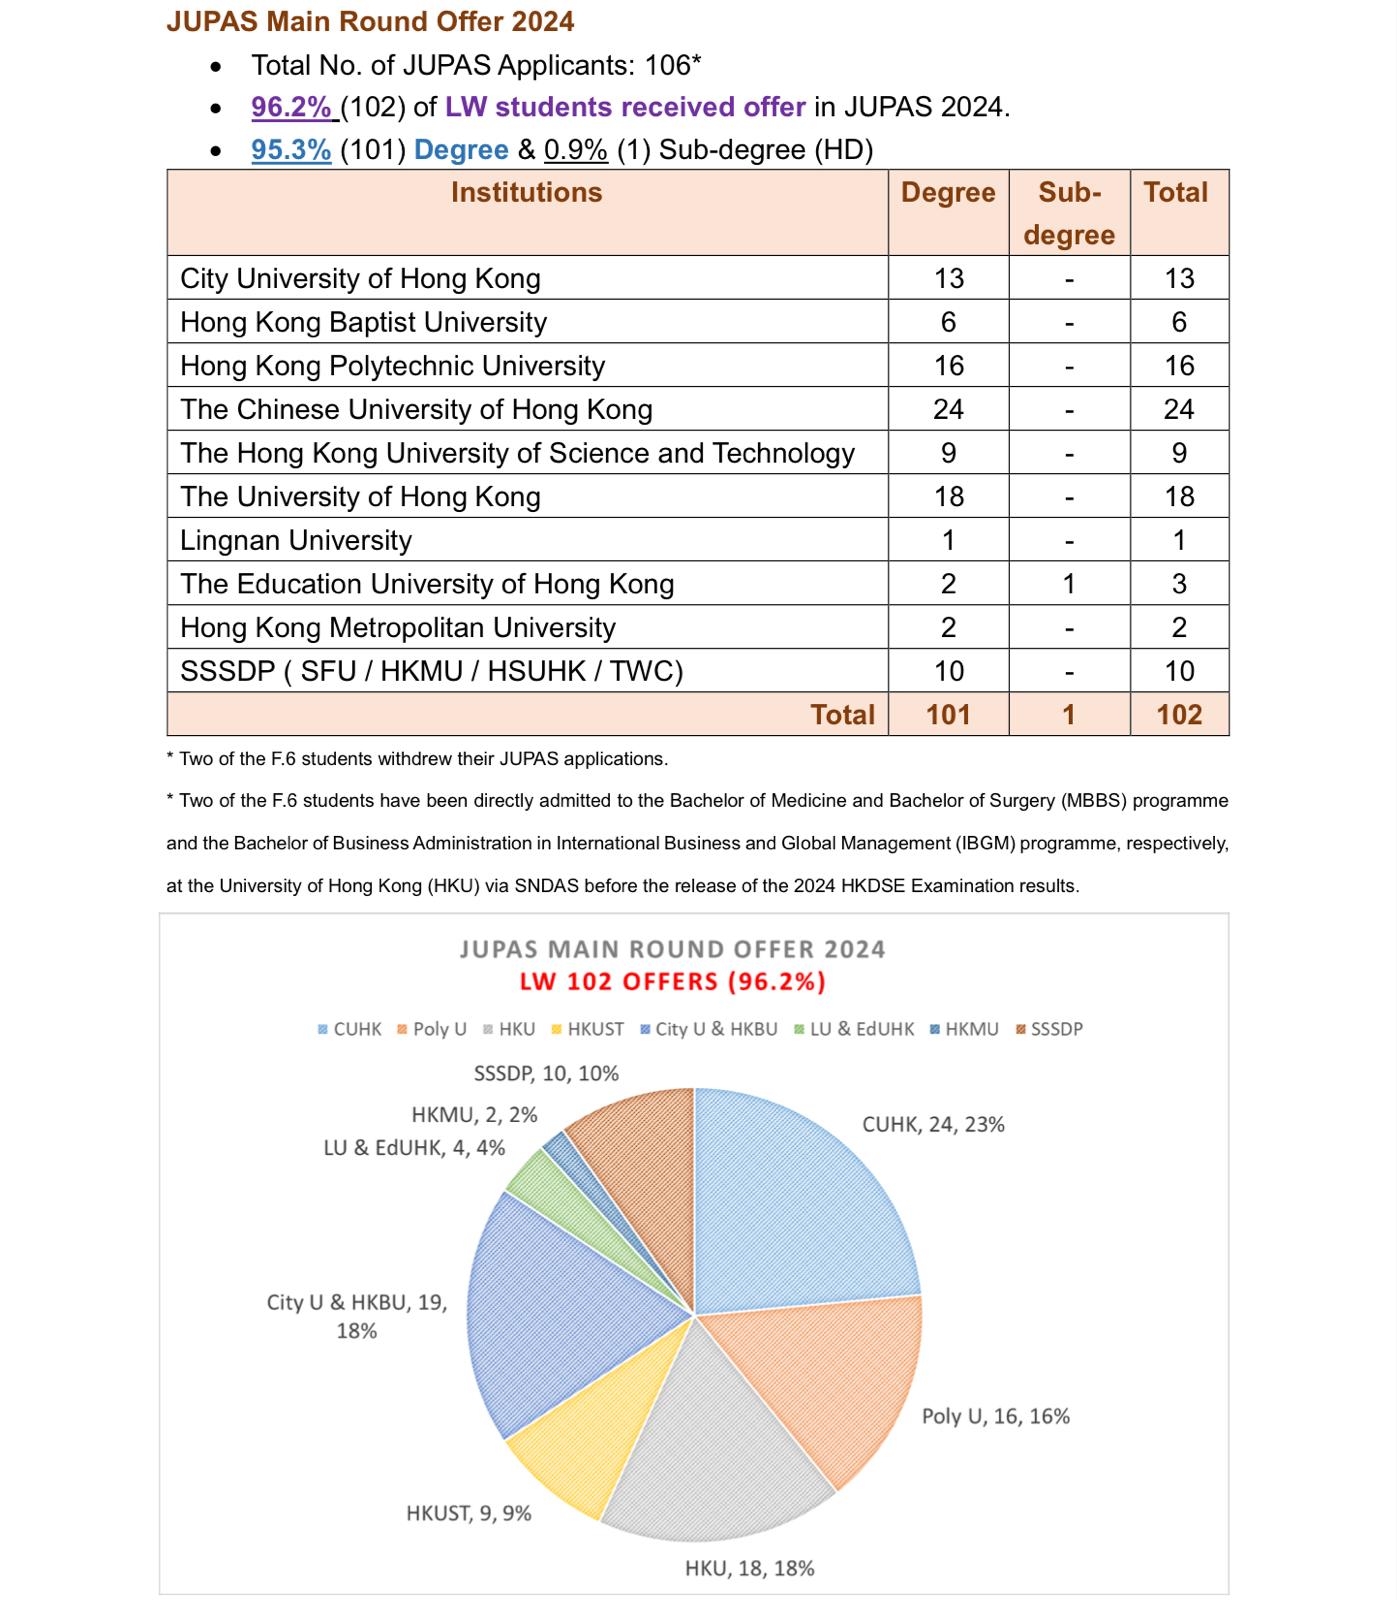
Placement
University Placement Analysis
| Placement Destinations | 2025Year | 2024Year | Change |
|---|---|---|---|
| Hong KongTop 3 Rate | 42.9% | 80.2% | ▼ 37.3% |
| JUPAS Rate | 91.8% | 92.7% | ▼ 0.9% |
| Bachelor and Associate Degree Rate | 93.6% | - | |
| 总本科率(本地+Overseas) | 92.7% | - | |
| Hong Kong本地本科率 | 92.7% | - | |
| Overseas本科率 | 0.0% | - | |
| SSSDP Rate | 9.1% | - | |
| Self-financed Degree Rate | 0.0% | - | |
| Higher Diploma Rate | 0.0% | - | |
| 副学士学位率 | 0.9% | - | |
| Progression Rate | 93.6% | - |
2025 University Tier Analysis
| University Tier | 2025Enrollment25Enrollment | 2025Enrollment%25% | 2025EnrollmentCumulative%25Cumulative | 2024Enrollment24Enrollment | 2024Enrollment%24% | 2024EnrollmentCumulative%24Cumulative | ΔOffers%Δ% |
|---|---|---|---|---|---|---|---|
| Total Students | 110 | 100.0% | - | 106 | 100.0% | - | - |
| UK Oxbridge | - | - | - | 1 | 0.9% | 0.9% | -0.9% |
| UK G5 | - | - | - | 2 | 1.9% | 2.8% | -1.9% |
| HK Top 3 | 45 | 40.9% | 40.9% | 51 | 48.1% | 50.9% | -7.2% |
| HK Top 4 | 12 | 10.9% | 51.8% | 16 | 15.1% | 66.0% | -4.2% |
| UK Top 10 | - | - | 51.8% | 1 | 0.9% | 67.0% | -0.9% |
| HK Top 5 | 5 | 4.5% | 56.4% | 13 | 12.3% | 79.2% | -7.7% |
| QS Top 100 | - | - | 56.4% | 1 | 0.9% | 80.2% | -0.9% |
Detailed University Placement Results
| University Name | 25 Matriculations25 Matric. | 25 Matric. %25 % | 24 Matriculations24 Matric. | 24 Matric. %24 % | QS | US | THE | Country |
|---|---|---|---|---|---|---|---|---|
University College London | - | - | 2 | 1.8% | 9 | - | - | United Kingdom |
The University of Hong Kong | 10 | 9.5% | 18 | 16.1% | 11 | - | - | 中国Hong Kong |
The University of Melbourne | - | - | 1 | 0.9% | 19 | - | - | Australia |
The University of Sydney | - | - | 1 | 0.9% | 25 | - | 54 | Australia |
The Chinese University of Hong Kong | 32 | 30.5% | 24 | 21.4% | 32 | - | 43 | 中国Hong Kong |
The Hong Kong University of Science and Technology | 3 | 2.9% | 9 | 8.0% | 44 | - | 60 | 中国Hong Kong |
The Hong Kong Polytechnic University | 12 | 11.4% | 16 | 14.3% | 54 | - | 80 | 中国Hong Kong |
City University of Hong Kong | 5 | 4.8% | 13 | 11.6% | 63 | - | 73 | 中国Hong Kong |
University of Birmingham | - | - | 1 | 0.9% | 76 | - | 98 | United Kingdom |
Brunel University | 1 | 1.0% | - | - | 385 | - | - | United Kingdom |
Hong Kong Baptist University | 5 | 4.8% | 6 | 5.4% | - | - | - | 中国Hong Kong |
The Education University of Hong Kong | 2 | 1.9% | 2 | 1.8% | - | - | - | 中国Hong Kong |
Hong Kong Metropolitan University | 4 | 3.8% | 2 | 1.8% | - | - | - | 中国Hong Kong |
HK SSSDP Universities | 26 | 24.8% | 10 | 8.9% | - | - | - | 中国Hong Kong |
University of New South Wales | 1 | 1.0% | - | - | - | - | - | Australia |
University of Bradford | 1 | 1.0% | - | - | - | - | - | United Kingdom |
University of East Anglia | 1 | 1.0% | - | - | - | - | - | United Kingdom |
National Tsing Hua University | - | - | 1 | 0.9% | - | - | - | 中国台湾 |
Middlesex University London | - | - | 1 | 0.9% | - | - | - | United Kingdom |
Lancaster University | - | - | 1 | 0.9% | - | - | 184 | United Kingdom |
Data Notes
Matriculation counts students who finally enroll at a university. Since each student enrolls in only one university, total matriculations usually do not exceed total graduates.
Offer counts admission offers received by students. A student may receive multiple offers, so total offers are usually higher than total graduates.
| University Name | 25 Matriculations25 Matric. | 25 Matric. %25 % | 24 Matriculations24 Matric. | 24 Matric. %24 % | QS | US | THE |
|---|---|---|---|---|---|---|---|
University of Cambridge | - | - | 1 | 0.9% | 6 | - | 4 |
University College London | - | - | 2 | 1.8% | 9 | - | - |
University of Bristol | - | - | 1 | 0.9% | 51 | - | 80 |
University of Birmingham | - | - | 1 | 0.9% | 76 | - | 98 |
Brunel University | 1 | 1.0% | - | - | 385 | - | - |
University of Bradford | 1 | 1.0% | - | - | - | - | - |
University of East Anglia | 1 | 1.0% | - | - | - | - | - |
Middlesex University London | - | - | 1 | 0.9% | - | - | - |
Lancaster University | - | - | 1 | 0.9% | - | - | 184 |
| University Name | 25 Matriculations25 Matric. | 25 Matric. %25 % | 24 Matriculations24 Matric. | 24 Matric. %24 % | QS | US | THE |
|---|---|---|---|---|---|---|---|
The University of Hong Kong | 10 | 9.5% | 18 | 16.1% | 11 | - | - |
The Chinese University of Hong Kong | 32 | 30.5% | 24 | 21.4% | 32 | - | 43 |
The Hong Kong University of Science and Technology | 3 | 2.9% | 9 | 8.0% | 44 | - | 60 |
The Hong Kong Polytechnic University | 12 | 11.4% | 16 | 14.3% | 54 | - | 80 |
City University of Hong Kong | 5 | 4.8% | 13 | 11.6% | 63 | - | 73 |
Hong Kong Baptist University | 5 | 4.8% | 6 | 5.4% | - | - | - |
The Education University of Hong Kong | 2 | 1.9% | 2 | 1.8% | - | - | - |
Hong Kong Metropolitan University | 4 | 3.8% | 2 | 1.8% | - | - | - |
HK SSSDP Universities | 26 | 24.8% | 10 | 8.9% | - | - | - |
| University Name | 25 Matriculations25 Matric. | 25 Matric. %25 % | 24 Matriculations24 Matric. | 24 Matric. %24 % | QS | US | THE |
|---|---|---|---|---|---|---|---|
The University of Melbourne | - | - | 1 | 0.9% | 19 | - | - |
The University of Sydney | - | - | 1 | 0.9% | 25 | - | 54 |
University of New South Wales | 1 | 1.0% | - | - | - | - | - |
Sources
×
1 / 1
Living
Living & Commute Recommendations
| # | Estate | Best Commute | Commute Time | Distance | Overall Score |
|---|---|---|---|---|---|
| Loading... | |||||
Note: Monthly rent/total price are estimates based on government RVD monthly residential averages by area and size, for school-living decisions only.
-