
N.T. Heung Yee Kuk Yuen Long District Secondary School
N.T. Heung Yee Kuk Yuen Long District Secondary School
- NTHYKYLDSS
新界乡议局元朗区中学(英语:New Territories Heung Yee Kuk Yuen Long District Secondary School;简称NTHYKYLDSS、乡中),位于新界元朗,为香港一所官立英文中学,由港英政府及新界乡议局于1967年创办,创校时为文法学校。现为香港两所新界乡议局官立中学之一,另一所是位于新界大埔的新界乡议局大埔区中学。
Overview
School Info
Band
Band 1a
School Gender
Co-ed
School Net
School Net Yl
Primary联系
Tuen Mun Government Primary School / Yuen Long Government Primary School / South Yuen Long Gov Pri Sch
Curriculum Type
ProfileType
官立
直升安排
Through-train
Curriculum Features
Hong Kong本地→DSE
Classes & Students
Age Group
12.31
Grade Setup
G7 - G12(S1 - S6)
Classes Count
4
Students / Class
平均33人/班
Total Students
833人
Teaching Language
Teaching Language
English
Chinese Characters
Traditional Chinese
Religion
Religion
No Religion
Founded
1967
费用情况
Annual Tuition
-
Other
Boarding Service
不提供寄宿
Entrance Exam
Chinese/English/Math Paper / English Interview / Cantonese Interview
Application Info
Minimum Application Grade
S2
Maximum Application Grade
S3
Eligible Application Grades
S2 / S3
Application Method
Phone Inquiry
Transfer Application Opens
❌
Transfer Application Deadline
❌
Useful Links
Contact
Phone
(852) 2476 6226 / 2476 6226
Email
nthykyldss@edb.gov.hk
Address
New Territories Yuen Long 区教育路 123 号
Map Location
New Territories鄉議局Yuen Long區Secondary
Student Distribution
Student Enrollment Trend
Select Data Year:
| Grade | 2024-2025 | 2023-2024 | Δ Students | ||||
|---|---|---|---|---|---|---|---|
| Students | Classes | Students / Class | Students | Classes | Students / Class | ||
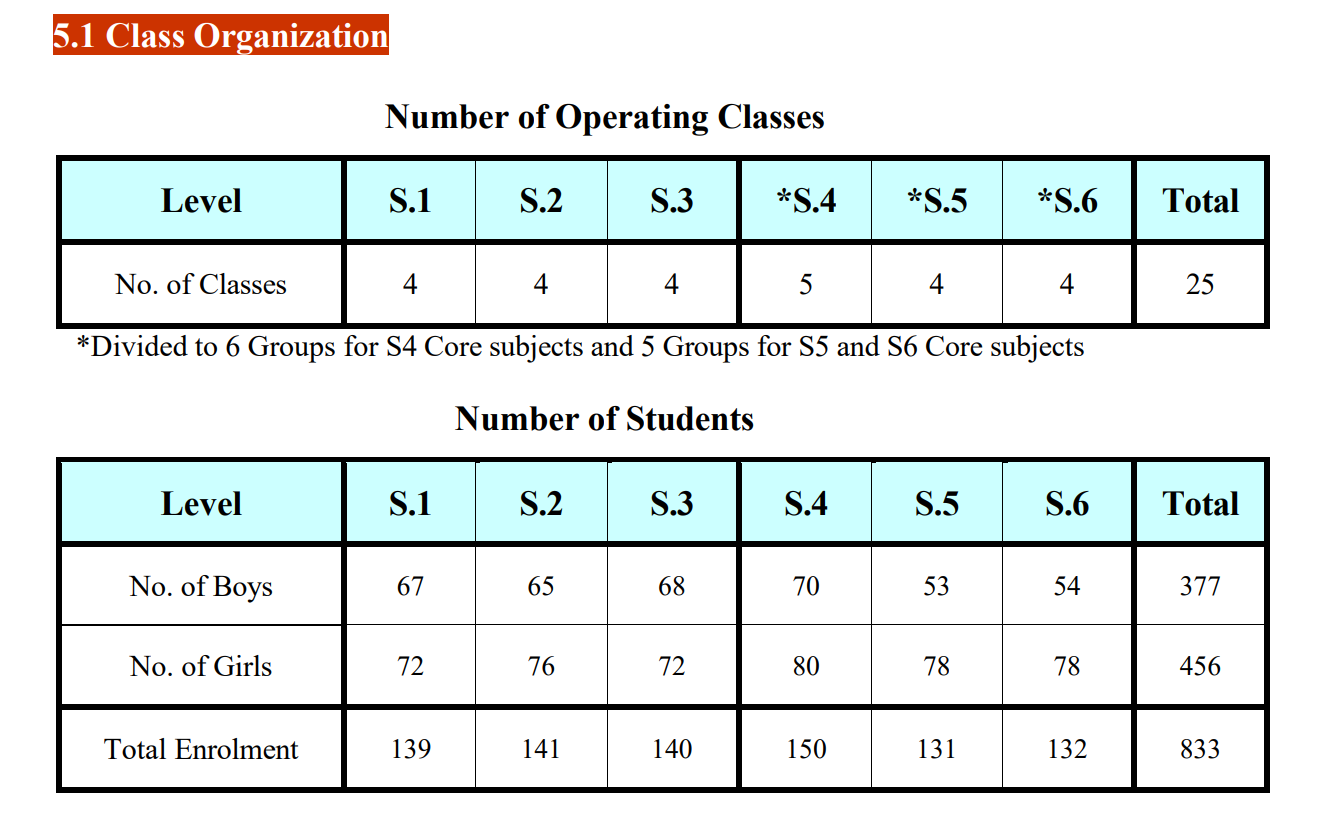
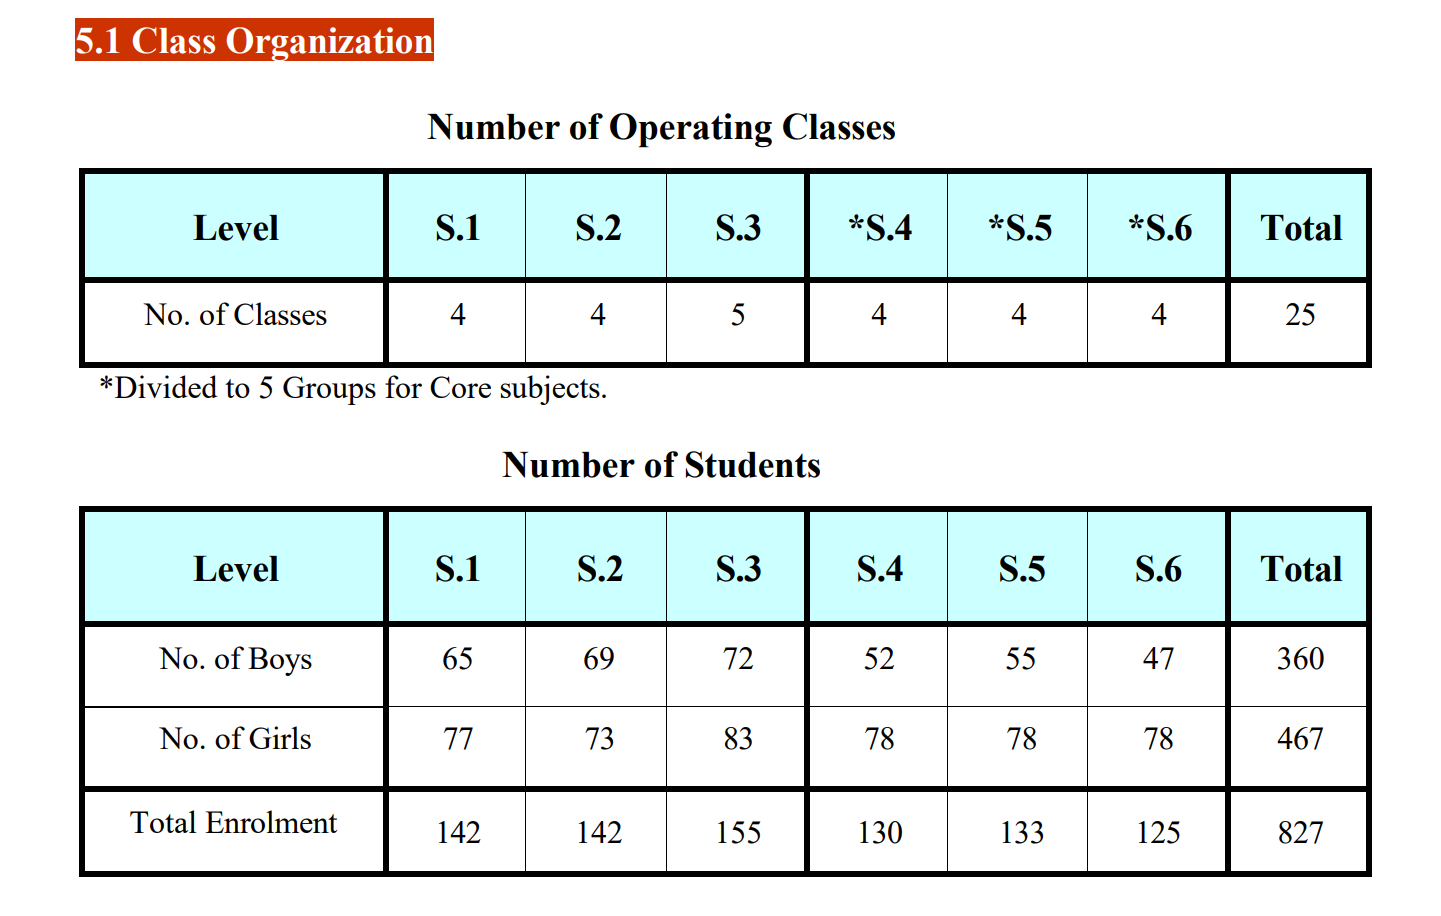
| S1 | 139 | 4 | 34.8 | 142 | 4 | 35.5 | - |
| S2 | 141 | 4 | 35.3 | 142 | 4 | 35.5 | ▼ 1 |
| S3 | 140 | 4 | 35 | 155 | 4 | 38.8 | ▼ 2 |
| S4 | 150 | 5 | 30 | 130 | 4 | 32.5 | ▼ 5 |
| S5 | 131 | 4 | 32.8 | 133 | 4 | 33.3 | ▲ 1 |
| S6 | 132 | 4 | 33 | 125 | 4 | 31.3 | ▼ 1 |
| Total | 833 | 25 | 33.3 | 827 | 24 | 34.5 | ▲ 6 |
* Δ Students = students in this grade this year − students in the lower grade last year. It indicates cohort-size change.
Sources
2024-2025 Student Distribution
2023-2024 Student Distribution
×
1 / 1
Exam
DSE Ranking
Rank 20 / 309
Higher Ranked
Lower Ranked
- #21 Wa Ying College
- #22 Munsang College
DSE Overview
| Metrics | 2025 | 2024 | 2023 | Change |
|---|---|---|---|---|
| Key Metrics | ||||
| 332A (Universities门槛) | 91.5% | 91.1% | 85.6% | ▲ 0.4% |
| 332A Notes | 332A22 | 332A22 | 33222 | - |
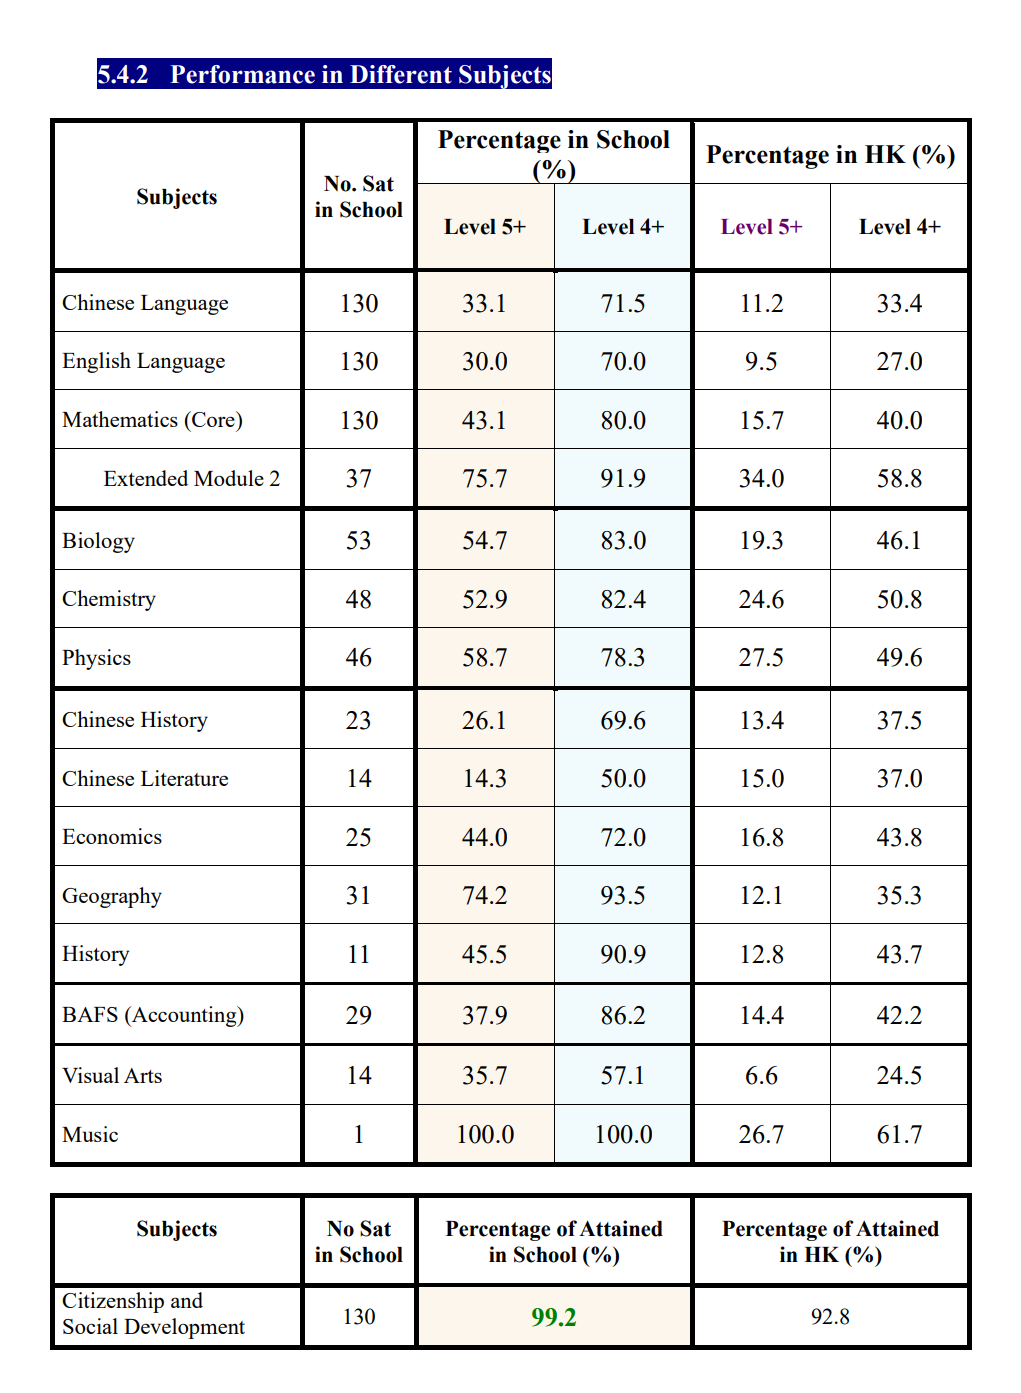
| 公民科合格率 | 99.2% | 100.0% | 100.0% | ▼ 0.8% |
| Level 5+ (优秀) | ||||
| Total 5+ | 43.4% | 37.2% | 41.2% | ▲ 6.2% |
| CEM 5+ (主科) | 35.4% | 34.7% | 38.0% | ▲ 0.7% |
| Chinese 5+ | 33.1% | 31.5% | 35.0% | ▲ 1.6% |
| English 5+ | 30.0% | 32.3% | 31.0% | ▼ 2.3% |
| 数学 5+ | 43.1% | 40.3% | 48.0% | ▲ 2.8% |
| Level 4+ (良好) | ||||
| Total 4+ | 77.1% | 70.7% | 74.7% | ▲ 6.4% |
| CEM 4+ (主科) | 73.8% | 71.0% | 66.4% | ▲ 2.8% |
| Chinese 4+ | 71.5% | 70.2% | 65.6% | ▲ 1.3% |
| English 4+ | 70.0% | 69.4% | 64.8% | ▲ 0.6% |
| 数学 4+ | 80.0% | 73.4% | 68.8% | ▲ 6.6% |
| Level 2+ (基础) | ||||
| Total 2+ | - | - | 100.0% | - |
| 人数 | ||||
| DSE Candidates | 130 | 124 | 125 | ▲ 6 |
| Count of 36+ | 13 | - | - | - |
DSE Subject Results
| Subject | 2025 (%) | 2024 (%) | Change |
|---|---|---|---|
| Chinese | 33.1 | 31.5 | ▲ 1.6 |
| Chinese History | 26.1 | 16.0 | ▲ 10.1 |
| Chinese Literature | 14.3 | 29.4 | ▼ 15.1 |
| English | 30.0 | 32.3 | ▼ 2.3 |
| Compulsory Mathematics | 43.1 | 40.3 | ▲ 2.8 |
| Mathematics M2 | 75.7 | 63.0 | ▲ 12.7 |
| Music | 100.0 | - | - |
| Geography | 74.2 | 70.8 | ▲ 3.4 |
| Physics | 58.7 | 47.4 | ▲ 11.3 |
| Biology | 54.7 | 47.8 | ▲ 6.9 |
| Chemistry | 52.9 | 58.3 | ▼ 5.4 |
| History | 45.5 | 20.0 | ▲ 25.5 |
| Economics | 44.0 | 26.3 | ▲ 17.7 |
| BAFS Accounting | 37.9 | 16.3 | ▲ 21.6 |
| Visual Arts | 35.7 | 28.6 | ▲ 7.1 |
| Chinese | 71.5 | 70.2 | ▲ 1.3 |
| Chinese History | 69.6 | 60.0 | ▲ 9.6 |
| Chinese Literature | 50.0 | 52.9 | ▼ 2.9 |
| English | 70.0 | 69.4 | ▲ 0.6 |
| Compulsory Mathematics | 80.0 | 73.4 | ▲ 6.6 |
| Mathematics M2 | 91.9 | 85.2 | ▲ 6.7 |
| Music | 100.0 | - | - |
| Geography | 93.5 | 100.0 | ▼ 6.5 |
| History | 90.9 | 66.7 | ▲ 24.2 |
| BAFS Accounting | 86.2 | 63.3 | ▲ 22.9 |
| Biology | 83.0 | 82.6 | ▲ 0.4 |
| Chemistry | 82.4 | 72.9 | ▲ 9.5 |
| Physics | 78.3 | 71.1 | ▲ 7.2 |
| Economics | 72.0 | 55.3 | ▲ 16.7 |
| Visual Arts | 57.1 | 42.9 | ▲ 14.2 |
Sources
×
1 / 1
Placement
University Placement Analysis
| Placement Destinations | 2025Year | 2024Year | Change |
|---|---|---|---|
| Hong KongTop 3 Rate | 49.2% | 41.9% | ▲ 7.3% |
| Hong KongTop 4 Rate | 56.9% | 48.4% | ▲ 8.5% |
| Hong KongTop 5 Rate | 60.8% | 55.6% | ▲ 5.2% |
| Hong Kong九大率 | 70.0% | 65.3% | ▲ 4.7% |
| JUPAS Rate | 86.1% | 65.3% | ▲ 20.8% |
| Bachelor and Associate Degree Rate | 80.0% | 98.4% | ▼ 18.4% |
| 总本科率(本地+Overseas) | 80.0% | 79.0% | ▲ 1.0% |
| Hong Kong本地本科率 | 72.3% | 72.6% | ▼ 0.3% |
| Overseas本科率 | 7.7% | 6.5% | ▲ 1.2% |
| SSSDP Rate | 2.3% | 7.3% | ▼ 5.0% |
| Progression Rate | 98.5% | 98.4% | ▲ 0.1% |
| Repeat Year Rate | 1.5% | 1.6% | ▼ 0.1% |
2025 University Tier Analysis
| University Tier | 2025Enrollment25Enrollment | 2025Enrollment%25% | 2025EnrollmentCumulative%25Cumulative | 2024Enrollment24Enrollment | 2024Enrollment%24% | 2024EnrollmentCumulative%24Cumulative | ΔOffers%Δ% |
|---|---|---|---|---|---|---|---|
| Total Students | 130 | 100.0% | - | 124 | 100.0% | - | - |
| HK Top 3 | 64 | 49.2% | 49.2% | 52 | 41.9% | 41.9% | +7.3% |
| HK Top 4 | 10 | 7.7% | 56.9% | 8 | 6.5% | 48.4% | +1.2% |
| HK Top 5 | 5 | 3.8% | 60.8% | 9 | 7.3% | 55.6% | -3.4% |
Detailed University Placement Results
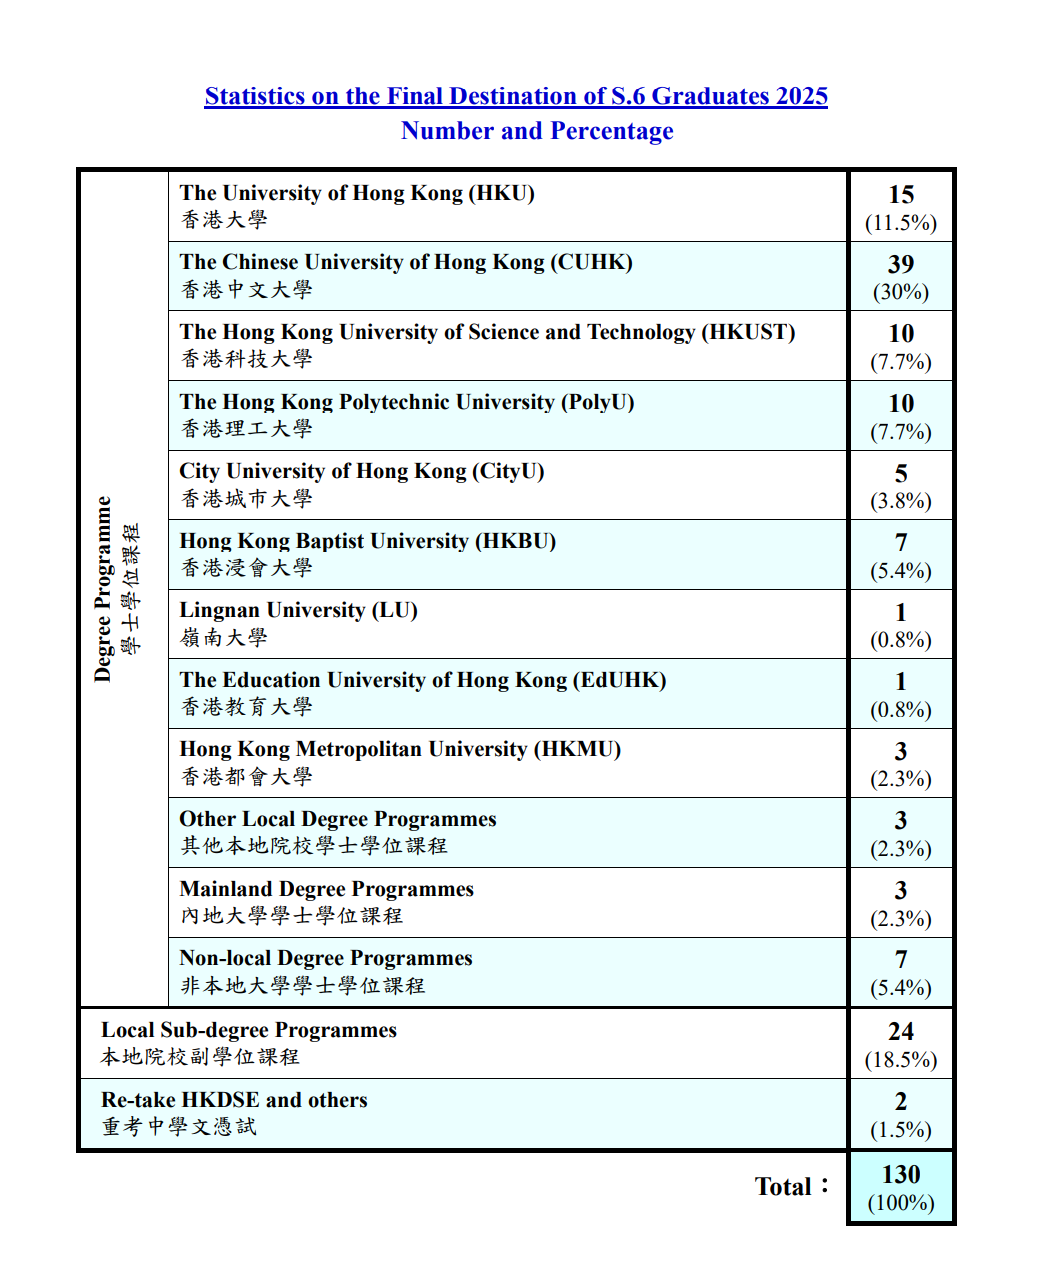
| University Name | 25 Matriculations25 Matric. | 25 Matric. %25 % | 24 Matriculations24 Matric. | 24 Matric. %24 % | QS | US | THE | Country |
|---|---|---|---|---|---|---|---|---|
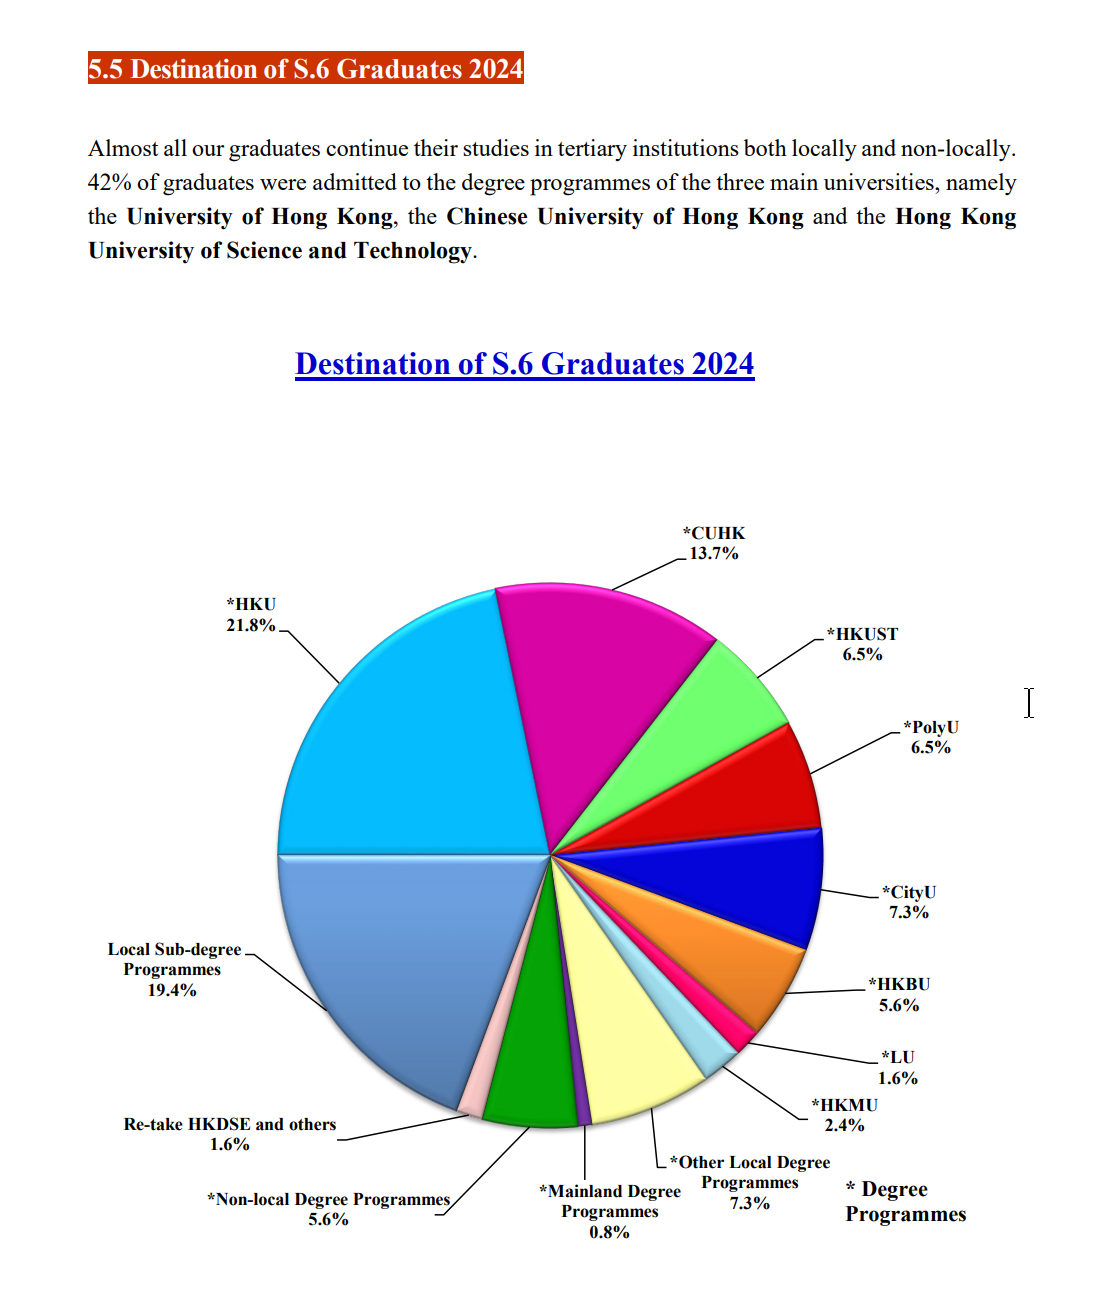
The University of Hong Kong | 15 | 11.5% | 27 | 21.8% | 11 | - | - | 中国Hong Kong |
The Chinese University of Hong Kong | 39 | 30.0% | 17 | 13.7% | 32 | - | 43 | 中国Hong Kong |
The Hong Kong University of Science and Technology | 10 | 7.7% | 8 | 6.5% | 44 | - | 60 | 中国Hong Kong |
The Hong Kong Polytechnic University | 10 | 7.7% | 8 | 6.5% | 54 | - | 80 | 中国Hong Kong |
City University of Hong Kong | 5 | 3.8% | 9 | 7.3% | 63 | - | 73 | 中国Hong Kong |
Hong Kong Baptist University | 7 | 5.4% | 7 | 5.6% | - | - | - | 中国Hong Kong |
Lingnan University, Hong Kong | 1 | 0.8% | 2 | 1.6% | - | - | - | 中国Hong Kong |
The Education University of Hong Kong | 1 | 0.8% | - | - | - | - | - | 中国Hong Kong |
Hong Kong Metropolitan University | 3 | 2.3% | 3 | 2.4% | - | - | - | 中国Hong Kong |
SSSDP | 3 | 2.3% | 9 | 7.3% | - | - | - | |
Overseas Universities | 10 | 7.7% | 8 | 6.5% | - | - | - | |
Associate Degree Program | 24 | 18.5% | 24 | 19.4% | - | - | - | 副学士/预科 |
Repeat Secondary | 2 | 1.5% | 2 | 1.6% | - | - | - |
Data Notes
Matriculation counts students who finally enroll at a university. Since each student enrolls in only one university, total matriculations usually do not exceed total graduates.
Offer counts admission offers received by students. A student may receive multiple offers, so total offers are usually higher than total graduates.
| University Name | 25 Matriculations25 Matric. | 25 Matric. %25 % | 24 Matriculations24 Matric. | 24 Matric. %24 % | QS | US | THE |
|---|---|---|---|---|---|---|---|
The University of Hong Kong | 15 | 11.5% | 27 | 21.8% | 11 | - | - |
The Chinese University of Hong Kong | 39 | 30.0% | 17 | 13.7% | 32 | - | 43 |
The Hong Kong University of Science and Technology | 10 | 7.7% | 8 | 6.5% | 44 | - | 60 |
The Hong Kong Polytechnic University | 10 | 7.7% | 8 | 6.5% | 54 | - | 80 |
City University of Hong Kong | 5 | 3.8% | 9 | 7.3% | 63 | - | 73 |
Hong Kong Baptist University | 7 | 5.4% | 7 | 5.6% | - | - | - |
Lingnan University, Hong Kong | 1 | 0.8% | 2 | 1.6% | - | - | - |
The Education University of Hong Kong | 1 | 0.8% | - | - | - | - | - |
Hong Kong Metropolitan University | 3 | 2.3% | 3 | 2.4% | - | - | - |
Sources
×
1 / 1
Living
Living & Commute Recommendations
| # | Estate | Best Commute | Commute Time | Distance | Overall Score |
|---|---|---|---|---|---|
| Loading... | |||||
Note: Monthly rent/total price are estimates based on government RVD monthly residential averages by area and size, for school-living decisions only.
-