
Sing Yin Secondary School
Sing Yin Secondary School
- SINGYIN
圣言中学(英语:Sing Yin Secondary School,缩写:SYSS)是香港一所天主教男子英文中学,于1970年成立。2011年9月迁入位于观塘区平山新清水湾道38号的新校舍。在2025香港最具教育竞争力中学50强龙虎榜中排名第34位。
圣言中学是于历届的香港中学文凭考试曾出产“7科5**状元”(在甲类科目中至少3个选修科及4个核心科获得5**成绩)的43间学校之一,截至2025年,共有1位。
Overview
School Info
Band
Band 1b
School Gender
Boys
School Net
School Net Kwoontong
Curriculum Type
ProfileType
Aided
直升安排
N/A
Curriculum Features
Hong Kong本地→DSE
Classes & Students
Age Group
12.31
Grade Setup
G7 - G12(S1 - S6)
Classes Count
5
Students / Class
平均34人/班
Total Students
约1,020人
Teaching Language
Teaching Language
English
Chinese Characters
Traditional Chinese
Religion
Religion
Catholicism
Founded
1970
费用情况
Annual Tuition
-
Other
Boarding Service
不提供寄宿
Entrance Exam
Chinese/English/Math Paper / English Interview / Cantonese Interview
Application Info
Minimum Application Grade
S2
Maximum Application Grade
S5
Eligible Application Grades
S2 / S3 / S4 / S5
Application Method
By Mail
Transfer Application Opens
-
Transfer Application Deadline
2025/6/30
Useful Links
Contact
Phone
(852) 2349 6281 / 2349 6281
Email
syadm@eservices.hkedcity.net
Address
Kowloon Wong Tai Sin 区牛池湾新清水湾道 38 号
Map Location
聖言Secondary
Fees
Fee Information
| Grade | School Level | Age | Fees | Stage |
|---|---|---|---|---|
| G10 | S4 | 15 | $340 | 中四 |
| G11 | S5 | 16 | $340 | 中五 |
| G12 | S6 | 17 | $340 | 中六 |
Secondary S1 - S30
HKDSE
Secondary S4 - S6$340
HKDSE
Sources

×
1 / 1
Exam
DSE Ranking
Rank 83 / 311
Higher Ranked
Lower Ranked
DSE Overview
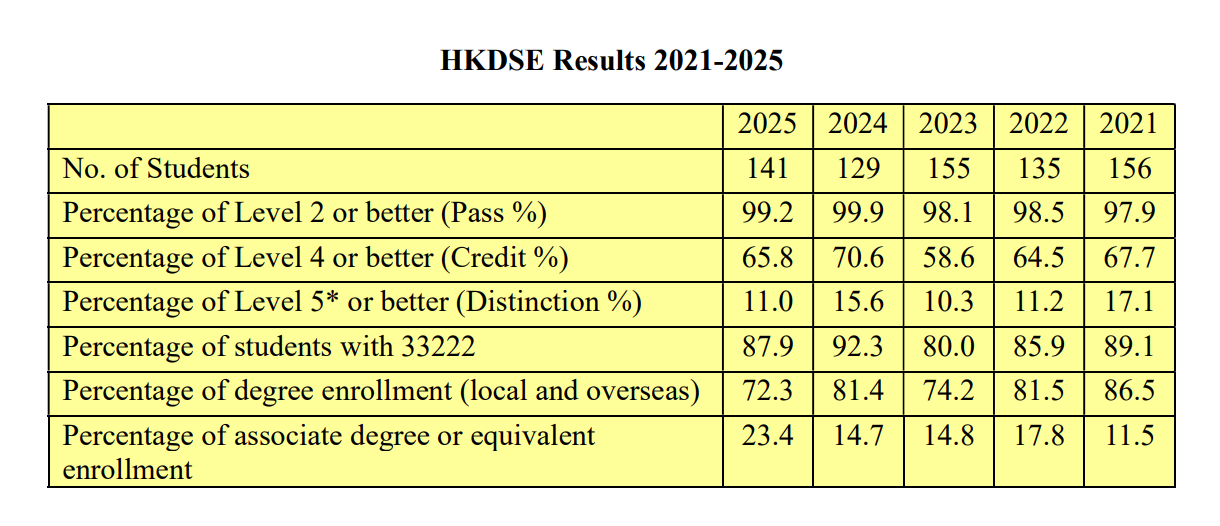
| Metrics | 2025 | 2024 | 2023 | Change |
|---|---|---|---|---|
| Key Metrics | ||||
| 332A (Universities门槛) | 87.9% | 92.3% | 80.0% | ▼ 4.4% |
| 332A Notes | 33222 | 33222 | 33222 | - |
| Level 5+ (优秀) | ||||
| Total 5+ | 28.5% | - | - | - |
| Total 5* | 11.0% | 15.6% | 10.3% | ▼ 4.6% |
| CEM 5+ (主科) | 21.7% | 29.3% | 58.0% | ▼ 7.6% |
| Chinese 5+ | 15.0% | 19.0% | 49.0% | ▼ 4.0% |
| English 5+ | 15.0% | 21.0% | 54.0% | ▼ 6.0% |
| 数学 5+ | 35.0% | 48.0% | 71.0% | ▼ 13.0% |
| Level 4+ (良好) | ||||
| Total 4+ | 65.8% | 70.6% | 58.6% | ▼ 4.8% |
| CEM 4+ (主科) | 66.3% | - | - | - |
| Chinese 4+ | 65.0% | - | - | - |
| English 4+ | 60.0% | - | - | - |
| 数学 4+ | 74.0% | - | - | - |
| Level 3+ (及格) | ||||
| Total 3+ | 90.8% | - | - | - |
| Level 2+ (基础) | ||||
| Total 2+ | 99.2% | 99.9% | 98.1% | ▼ 0.7% |
| CEM 2+ (主科) | - | - | 99.0% | - |
| Chinese 2+ | - | - | 99.0% | - |
| English 2+ | - | - | 99.0% | - |
| 数学 2+ | - | - | 99.0% | - |
| 人数 | ||||
| DSE Candidates | 141 | 129 | 155 | ▲ 12 |
DSE Subject Results
| Subject | 2025 (%) | 2024 (%) | Change |
|---|---|---|---|
| Chinese | 100.0 | 67.0 | ▲ 33.0 |
| Chinese History | 71.0 | 64.0 | ▲ 7.0 |
| Chinese Literature | 14.0 | 20.0 | ▼ 6.0 |
| English | 58.0 | 60.0 | ▼ 2.0 |
| Compulsory Mathematics | 74.0 | 85.0 | ▼ 11.0 |
| Mathematics M1 | 57.0 | 28.0 | ▲ 29.0 |
| Mathematics M2 | 57.0 | 75.0 | ▼ 18.0 |
| Physical Education | 100.0 | - | - |
| Biology | 94.0 | 94.0 | - |
| Chemistry | 72.0 | 80.0 | ▼ 8.0 |
| ICT | 72.0 | 71.0 | ▲ 1.0 |
| Physics | 71.0 | 84.0 | ▼ 13.0 |
| Economics | 65.0 | 63.0 | ▲ 2.0 |
| History | 60.0 | 52.0 | ▲ 8.0 |
| BAFS Accounting | 57.0 | 73.0 | ▼ 16.0 |
| Geography | 56.0 | 76.0 | ▼ 20.0 |
| Music | 50.0 | - | - |
| Visual Arts | - | 0.0 | - |
| Chinese | 100.0 | 100.0 | - |
| Chinese History | 100.0 | 100.0 | - |
| Chinese Literature | 100.0 | 100.0 | - |
| English | 100.0 | 100.0 | - |
| Compulsory Mathematics | 99.0 | 100.0 | ▼ 1.0 |
| Mathematics M1 | 97.0 | 97.0 | - |
| Mathematics M2 | 94.0 | 100.0 | ▼ 6.0 |
| BAFS Accounting | 100.0 | 100.0 | - |
| Biology | 100.0 | 100.0 | - |
| Chemistry | 100.0 | 100.0 | - |
| Economics | 100.0 | 100.0 | - |
| History | 100.0 | 100.0 | - |
| ICT | 100.0 | 100.0 | - |
| Music | 100.0 | - | - |
| Physical Education | 100.0 | - | - |
| Physics | 100.0 | 100.0 | - |
| Visual Arts | - | 100.0 | - |
| Geography | 94.0 | 100.0 | ▼ 6.0 |
Sources

×
1 / 1
Placement
University Placement Analysis
| Placement Destinations | 2025Year | 2024Year | Change |
|---|---|---|---|
| Hong KongTop 3 Rate | 37.8% | 45.7% | ▼ 7.9% |
| Hong KongTop 4 Rate | 45.2% | 52.7% | ▼ 7.5% |
| Hong KongTop 5 Rate | 49.6% | 65.9% | ▼ 16.3% |
| Hong Kong九大率 | 61.5% | 76.7% | ▼ 15.2% |
| JUPAS Rate | 61.5% | 76.7% | ▼ 15.2% |
| Bachelor and Associate Degree Rate | 75.6% | 81.4% | ▼ 5.8% |
| 总本科率(本地+Overseas) | 75.6% | 81.4% | ▼ 5.8% |
| Hong Kong本地本科率 | 69.6% | 79.8% | ▼ 10.2% |
| Overseas本科率 | 5.9% | 1.6% | ▲ 4.3% |
| 副学士/Higher Diploma Rate | 24.4% | 13.2% | ▲ 11.2% |
| Progression Rate | 100.0% | 96.1% | ▲ 3.9% |
| Repeat Year Rate | - | 1.6% | - |
2025 University Tier Analysis
| University Tier | 2025Enrollment25Enrollment | 2025Enrollment%25% | 2025EnrollmentCumulative%25Cumulative | 2024Enrollment24Enrollment | 2024Enrollment%24% | 2024EnrollmentCumulative%24Cumulative | ΔOffers%Δ% |
|---|---|---|---|---|---|---|---|
| Total Students | 141 | 100.0% | - | 129 | 100.0% | - | - |
| HK Top 3 | 51 | 36.2% | 36.2% | 59 | 45.7% | 45.7% | -9.6% |
| HK Top 4 | 10 | 7.1% | 43.3% | 9 | 7.0% | 52.7% | +0.1% |
| HK Top 5 | 6 | 4.3% | 47.5% | 17 | 13.2% | 65.9% | -8.9% |
Detailed University Placement Results
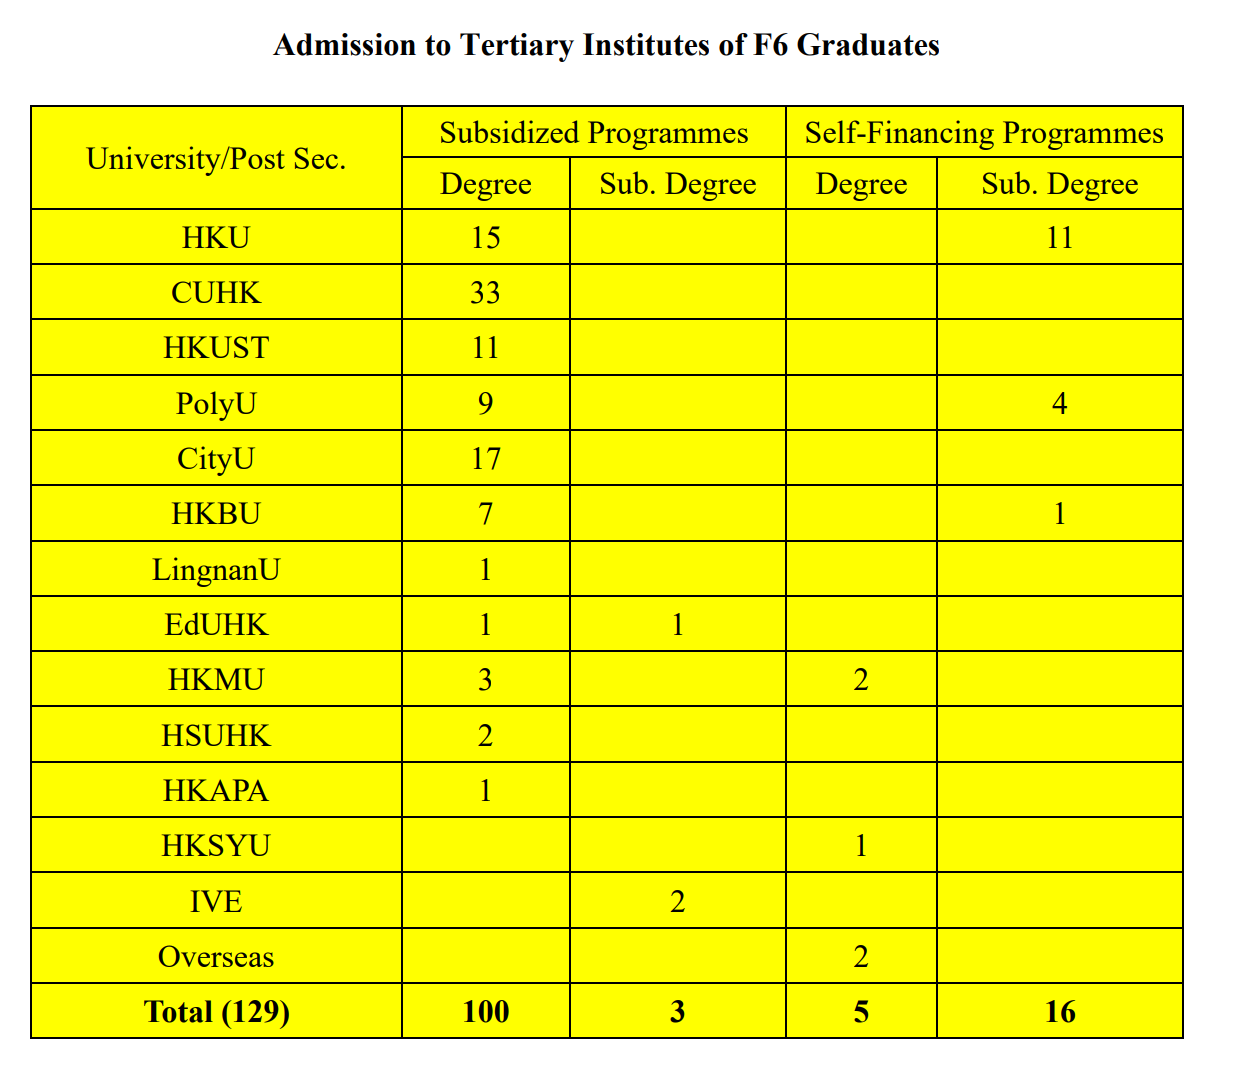
| University Name | 25 Matriculations25 Matric. | 25 Matric. %25 % | 24 Matriculations24 Matric. | 24 Matric. %24 % | QS | US | THE | Country |
|---|---|---|---|---|---|---|---|---|
The University of Hong Kong | 10 | 7.4% | 15 | 11.6% | 11 | - | - | 中国Hong Kong |
The Chinese University of Hong Kong | 29 | 21.5% | 33 | 25.6% | 32 | - | 43 | 中国Hong Kong |
The Hong Kong University of Science and Technology | 12 | 8.9% | 11 | 8.5% | 44 | - | 60 | 中国Hong Kong |
The Hong Kong Polytechnic University | 10 | 7.4% | 9 | 7.0% | 54 | - | 80 | 中国Hong Kong |
City University of Hong Kong | 6 | 4.4% | 17 | 13.2% | 63 | - | 73 | 中国Hong Kong |
Hong Kong Baptist University | 4 | 3.0% | 7 | 5.4% | - | - | - | 中国Hong Kong |
Lingnan University, Hong Kong | - | - | 1 | 0.8% | - | - | - | 中国Hong Kong |
The Education University of Hong Kong | - | - | 1 | 0.8% | - | - | - | 中国Hong Kong |
Hong Kong Metropolitan University | 12 | 8.9% | 5 | 3.9% | - | - | - | 中国Hong Kong |
Hang Seng University of Hong Kong | - | - | 2 | 1.6% | - | - | - | 中国Hong Kong |
Hong Kong Academy for Performing Arts | - | - | 1 | 0.8% | - | - | - | 中国Hong Kong |
Tung Wah College | 4 | 3.0% | - | - | - | - | - | 中国Hong Kong |
Hong Kong Shue Yan University | 4 | 3.0% | 1 | 0.8% | - | - | - | 中国Hong Kong |
Saint Francis University | 3 | 2.2% | - | - | - | - | - | 中国Hong Kong |
Overseas Universities | 8 | 5.9% | 2 | 1.6% | - | - | - | |
Associate Degree Program | 33 | 24.4% | 17 | 13.2% | - | - | - | 副学士/预科 |
Others/National Service | - | - | 2 | 1.6% | - | - | - | Other |
Repeat Secondary | - | - | 5 | 3.9% | - | - | - |
Data Notes
Matriculation counts students who finally enroll at a university. Since each student enrolls in only one university, total matriculations usually do not exceed total graduates.
Offer counts admission offers received by students. A student may receive multiple offers, so total offers are usually higher than total graduates.
| University Name | 25 Matriculations25 Matric. | 25 Matric. %25 % | 24 Matriculations24 Matric. | 24 Matric. %24 % | QS | US | THE |
|---|---|---|---|---|---|---|---|
The University of Hong Kong | 10 | 7.4% | 15 | 11.6% | 11 | - | - |
The Chinese University of Hong Kong | 29 | 21.5% | 33 | 25.6% | 32 | - | 43 |
The Hong Kong University of Science and Technology | 12 | 8.9% | 11 | 8.5% | 44 | - | 60 |
The Hong Kong Polytechnic University | 10 | 7.4% | 9 | 7.0% | 54 | - | 80 |
City University of Hong Kong | 6 | 4.4% | 17 | 13.2% | 63 | - | 73 |
Hong Kong Baptist University | 4 | 3.0% | 7 | 5.4% | - | - | - |
Lingnan University, Hong Kong | - | - | 1 | 0.8% | - | - | - |
The Education University of Hong Kong | - | - | 1 | 0.8% | - | - | - |
Hong Kong Metropolitan University | 12 | 8.9% | 5 | 3.9% | - | - | - |
Hang Seng University of Hong Kong | - | - | 2 | 1.6% | - | - | - |
Hong Kong Academy for Performing Arts | - | - | 1 | 0.8% | - | - | - |
Tung Wah College | 4 | 3.0% | - | - | - | - | - |
Hong Kong Shue Yan University | 4 | 3.0% | 1 | 0.8% | - | - | - |
Saint Francis University | 3 | 2.2% | - | - | - | - | - |
Sources

×
1 / 1
Living
Living & Commute Recommendations
| # | Estate | Best Commute | Commute Time | Distance | Overall Score |
|---|---|---|---|---|---|
| Loading... | |||||
Note: Monthly rent/total price are estimates based on government RVD monthly residential averages by area and size, for school-living decisions only.
-